PnL Scoring
This proposal is part of the collateral V2 changes described in P22. Vanta Network currently evaluates miners using five risk-adjusted performance metrics. We propose adding a profit-based metric to create direct competition on gains and account size while preserving the existing risk-adjusted performance evaluation. The new structure assigns 30% weight to this profit metric and 14% to each risk-adjusted metric (70% combined).
Problem Statement
Under collateral V2, the existing risk-adjusted metrics based on daily returns would fail to appropriately differentiate between miners operating at different capital amounts. This creates an inequity where miners with identical risk-adjusted performance but differing account sizes receive the same amount of incentive.
Here are the key issues:
- Miners demonstrating strong performance while maintaining large account sizes deserve appropriate benefit. Market impact and slippage costs increase with position size, making consistent performance significantly more challenging with more starting capital.
- The current system may not properly incentivize people on the network to consolidate funds into their strongest strategies rather than splitting capital among many miners.
Proposed Solution
We propose the introduction of a PnL-based metric that creates direct competition on daily USD changes in portfolio value. This approach assesses the risk-adjusted performance of miners within the context of their account sizes. Daily profit calculations will track the absolute USD change in portfolio value from full trading days (as defined for daily returns), aggregated using recency-weighted averaging consistent with the current metrics. Note that tracked account sizes are updated daily for the purposes of scoring and any change to account size requires the closure of all positions.
Simulated Impact
In the graphs below, we selected the top 25 miners in the main competition to analyze how the new PnL-based metric would impact the network. The miner weights are determined with the 70/30 split for the risk-adjusted metrics and PnL respectively described above and their current daily returns.
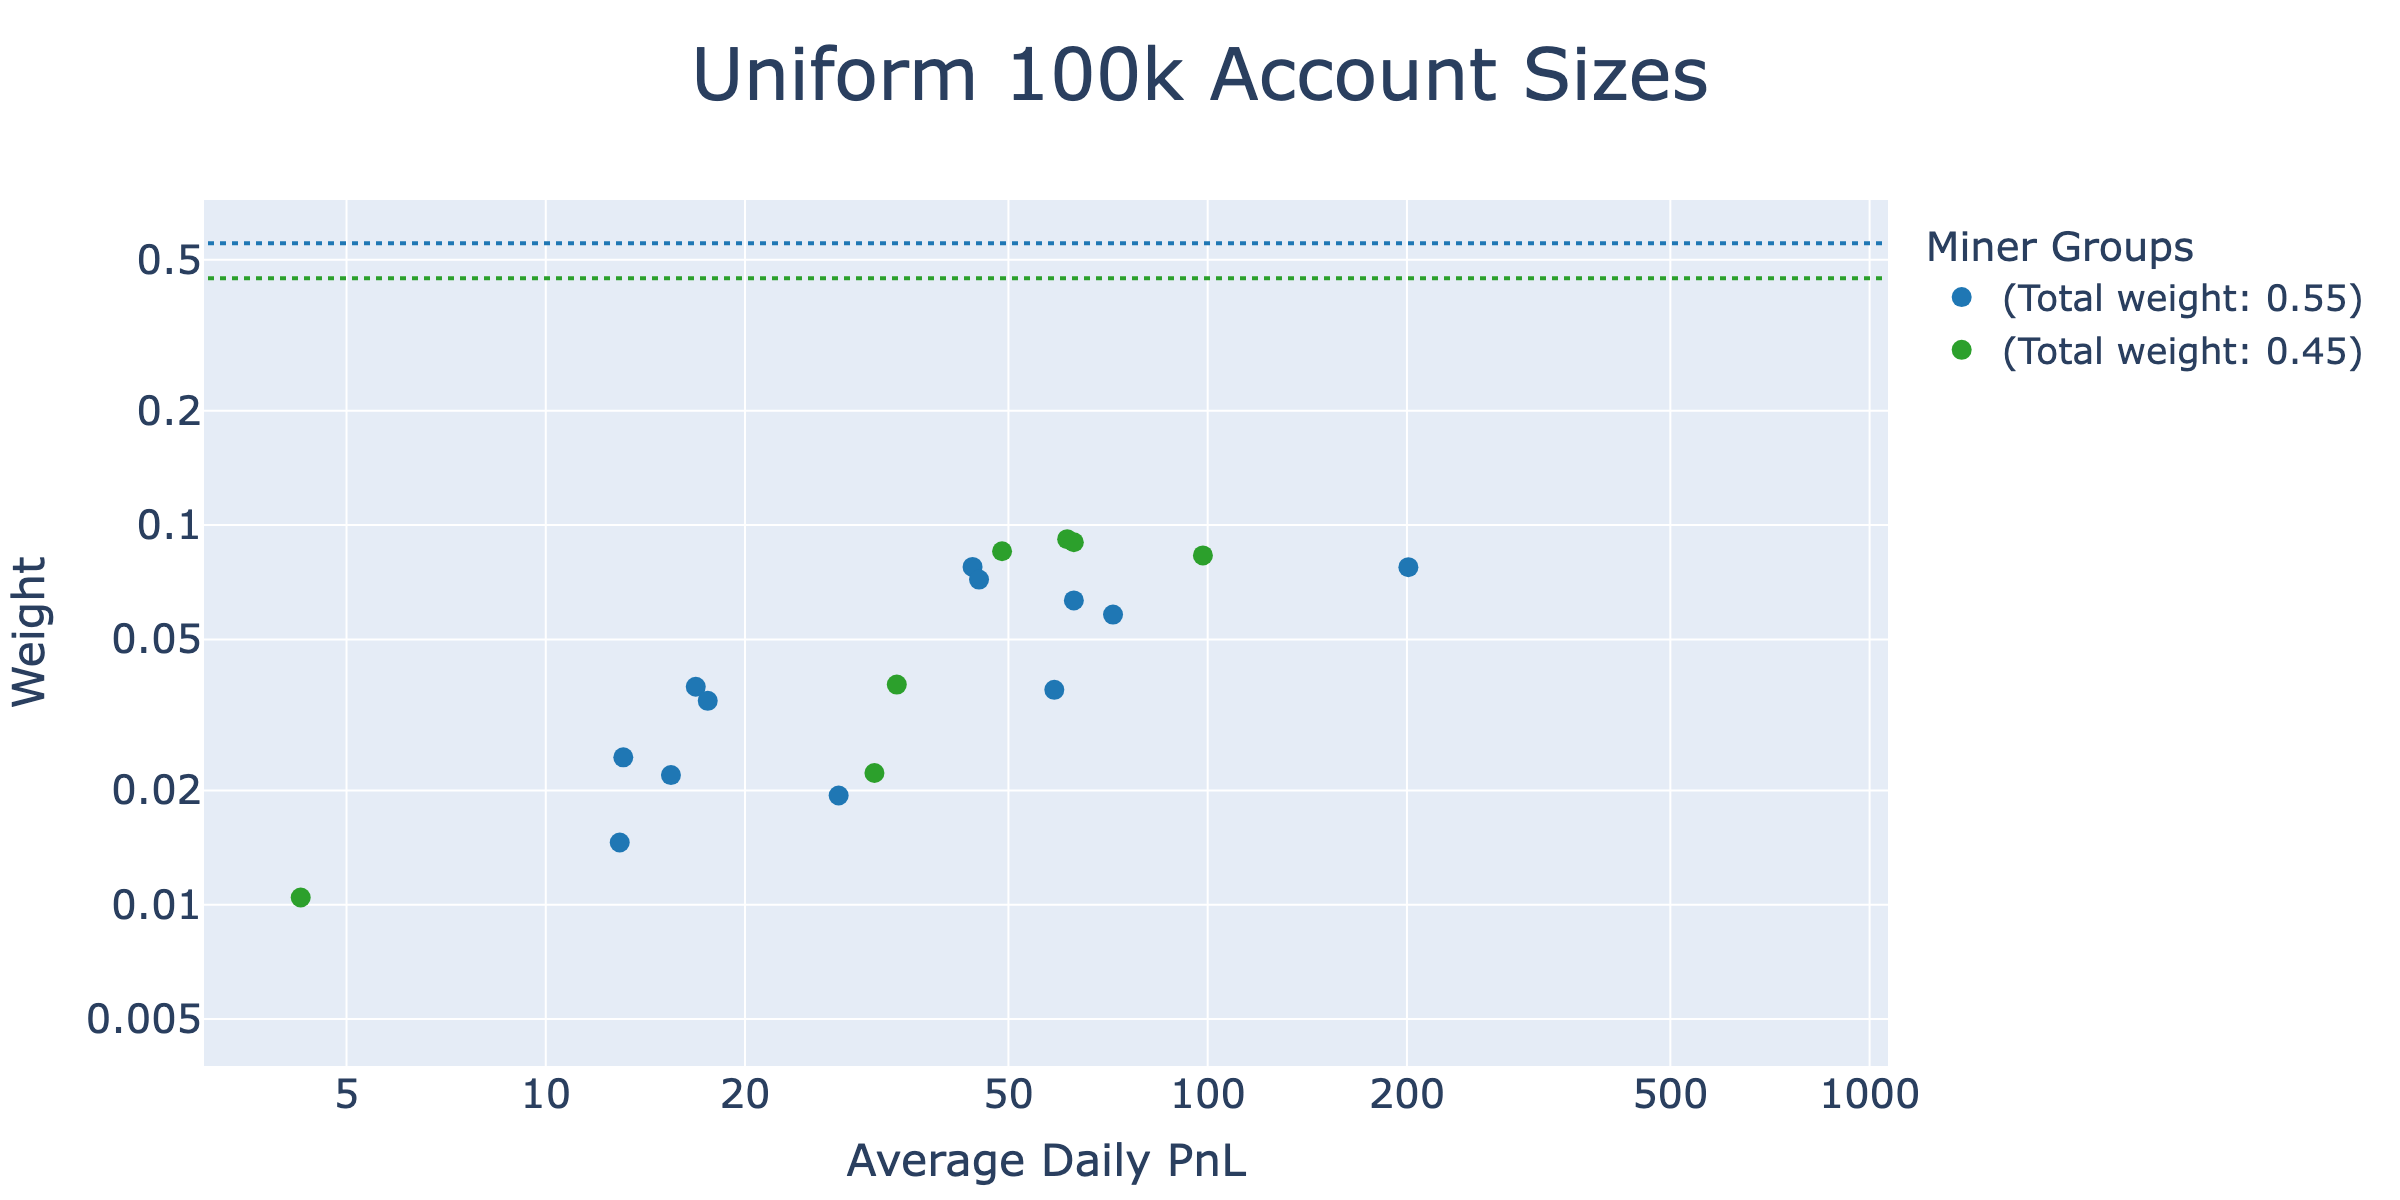
The first graph shows the network weight miners receive versus their average daily PnL values with all miners assumed to have a 100,000 USD account size. Miners were randomly placed into two groups with the sum of network weight for each group being shown with the dotted lines.
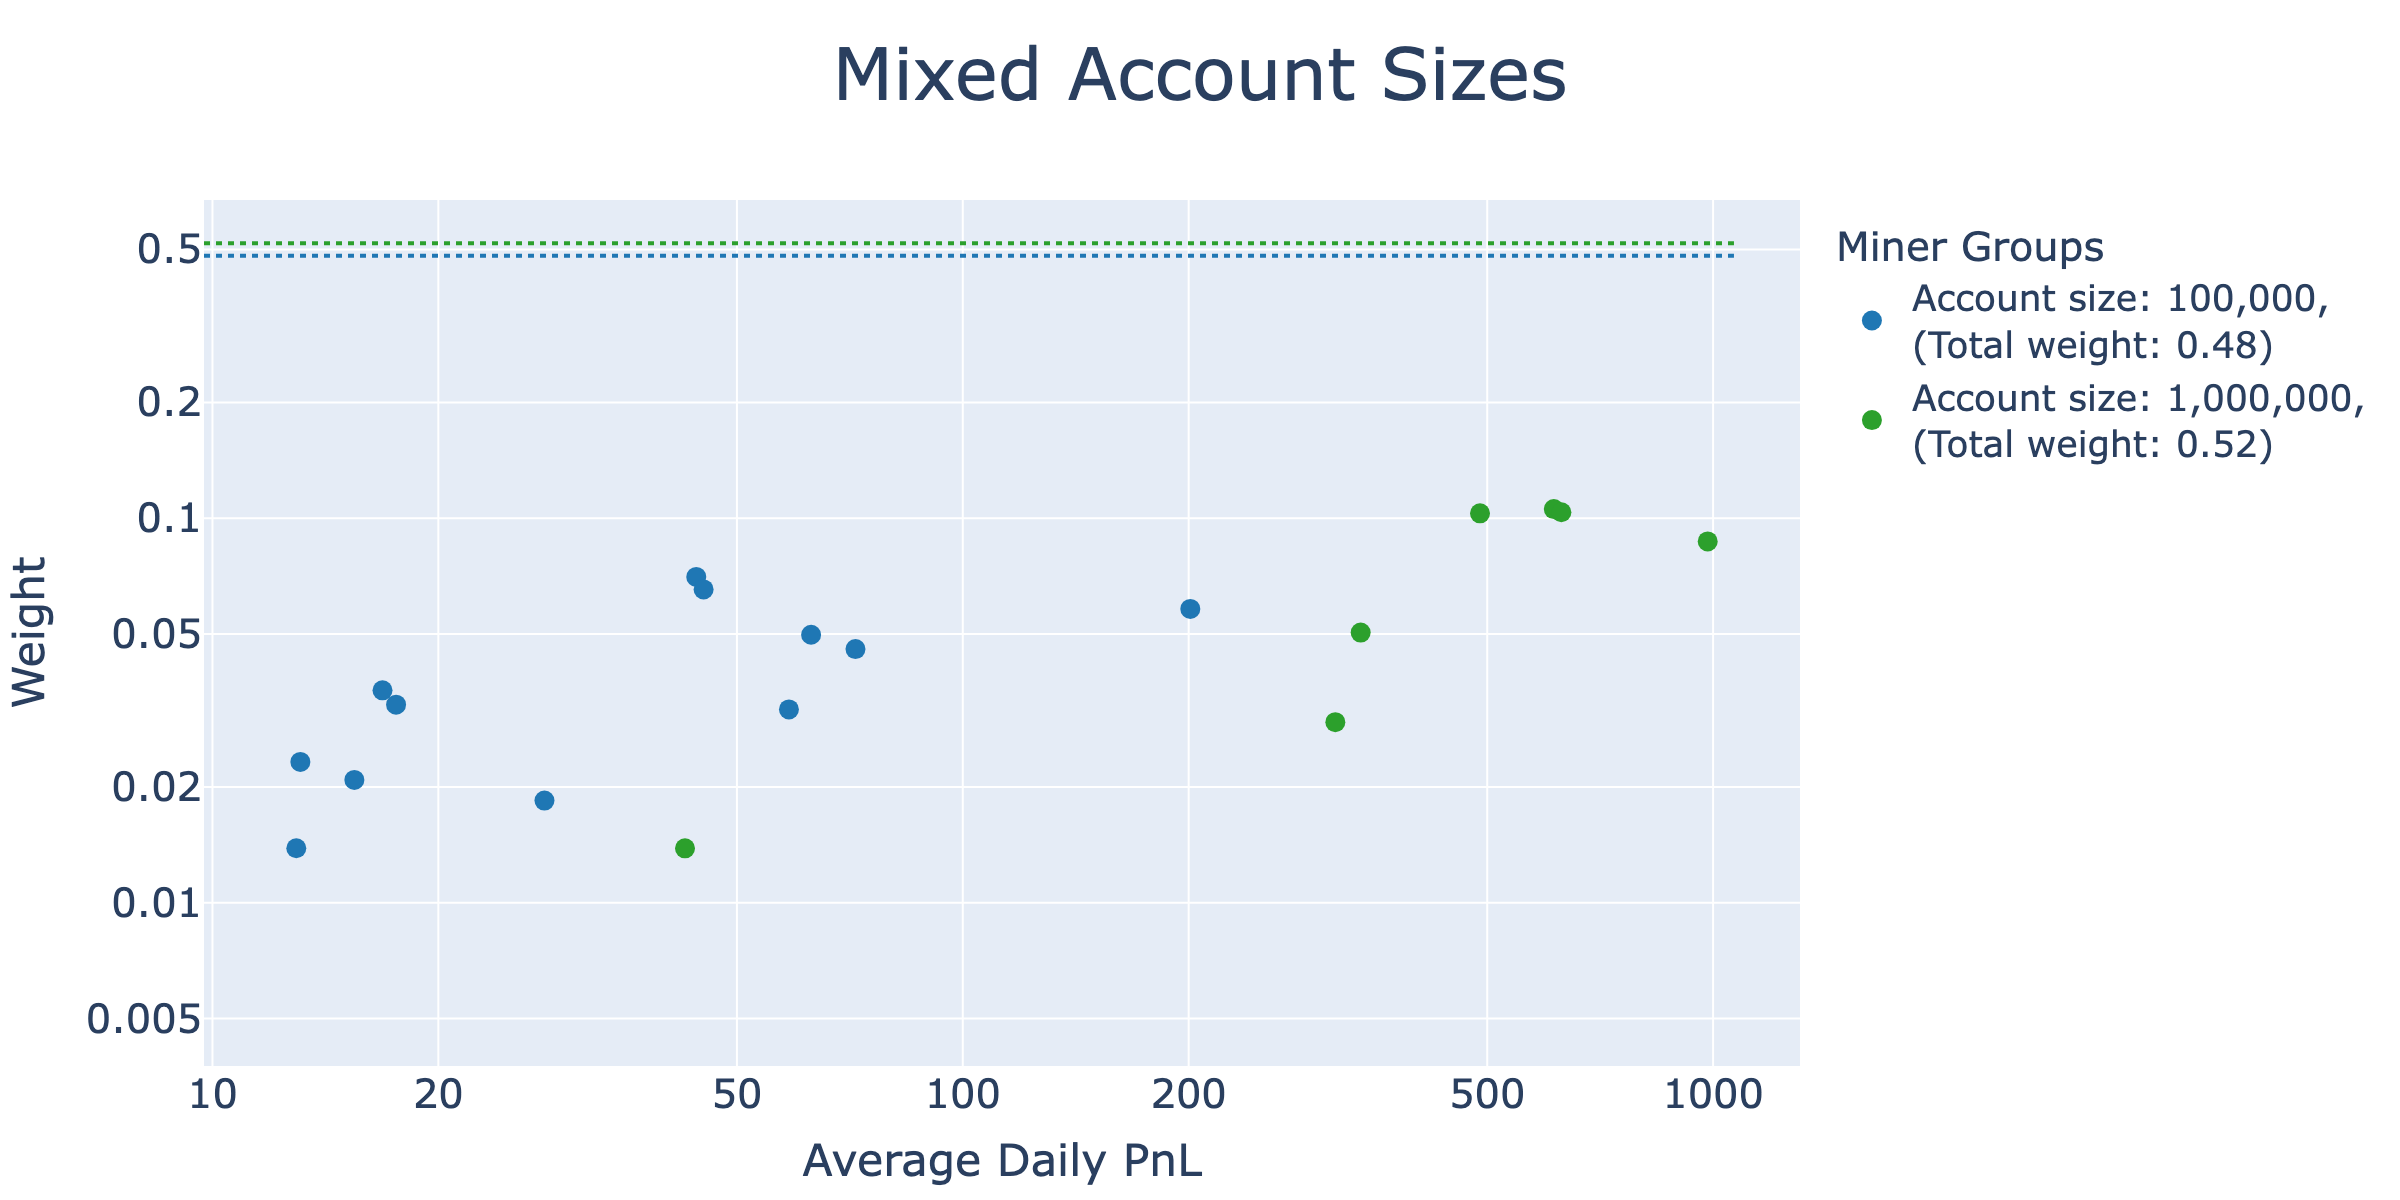
The second graph displays these same miners (miners in the blue group in the first graph are still in the blue group), but the groups have different account sizes. Their USD PnL values were recalculated with their assigned account sizes and they were scored again.
With risk-adjusted metric scores remaining the same in both graphs, network weight ultimately shifted towards the group with 1 million USD account sizes. The current risk-adjusted metrics still play a large role in determining miner weights, but adding a PnL-based metric will align the distributed incentive more closely with direct miner performance. This reflects our intention of providing more weight to high-performing strategies with large account sizes while still heavily considering risk-adjusted metrics to incentivize a robust and diverse network of miners.
Timeline
Proposal delivery: Jul 25, 2025
PR: Jul 28, 2025
Integration: TBD