Hard to Escape- Protecting the Network from Runaway Leverage Utilization
Martingale Methodology and Its Risks
The Martingale methodology, characterized by doubling down into a losing position without a knowledgeable strategy, can lead to the catastrophic collapse of portfolio value. By continually adding to a position as the asset drops, a Martingale strategy will take on a steep drawdown. If this strategy is applied to an over-leveraged position, the trader may quickly wipe out the entire portfolio value.
Network Strategy and Risk Management
Our network strategy uses the combination of top miner positions to generate a system-level strategy based on the aggregation of all miner positions. If there were an influential miner employing Martingale without proper risk exposure in our system, it would indeed be very detrimental. Let’s go through the specific components of Martingale that make it harmful and discuss how these symptoms interact with the incentive mechanism on SN8.
Setting the Stage: Martingale Approach to Ethereum Price Changes
In the first two weeks of June 2024, Ethereum’s value declined. Below is a visualization of exponential scaling into a position, a classic indicator of this naive strategy. The blue lines indicate LONG positions, while the red line indicates the closing of the position. The width of the line is a visual indicator of the size of the order. As the price drops, the hypothetical Martingale miner doubles down on the size of the position.
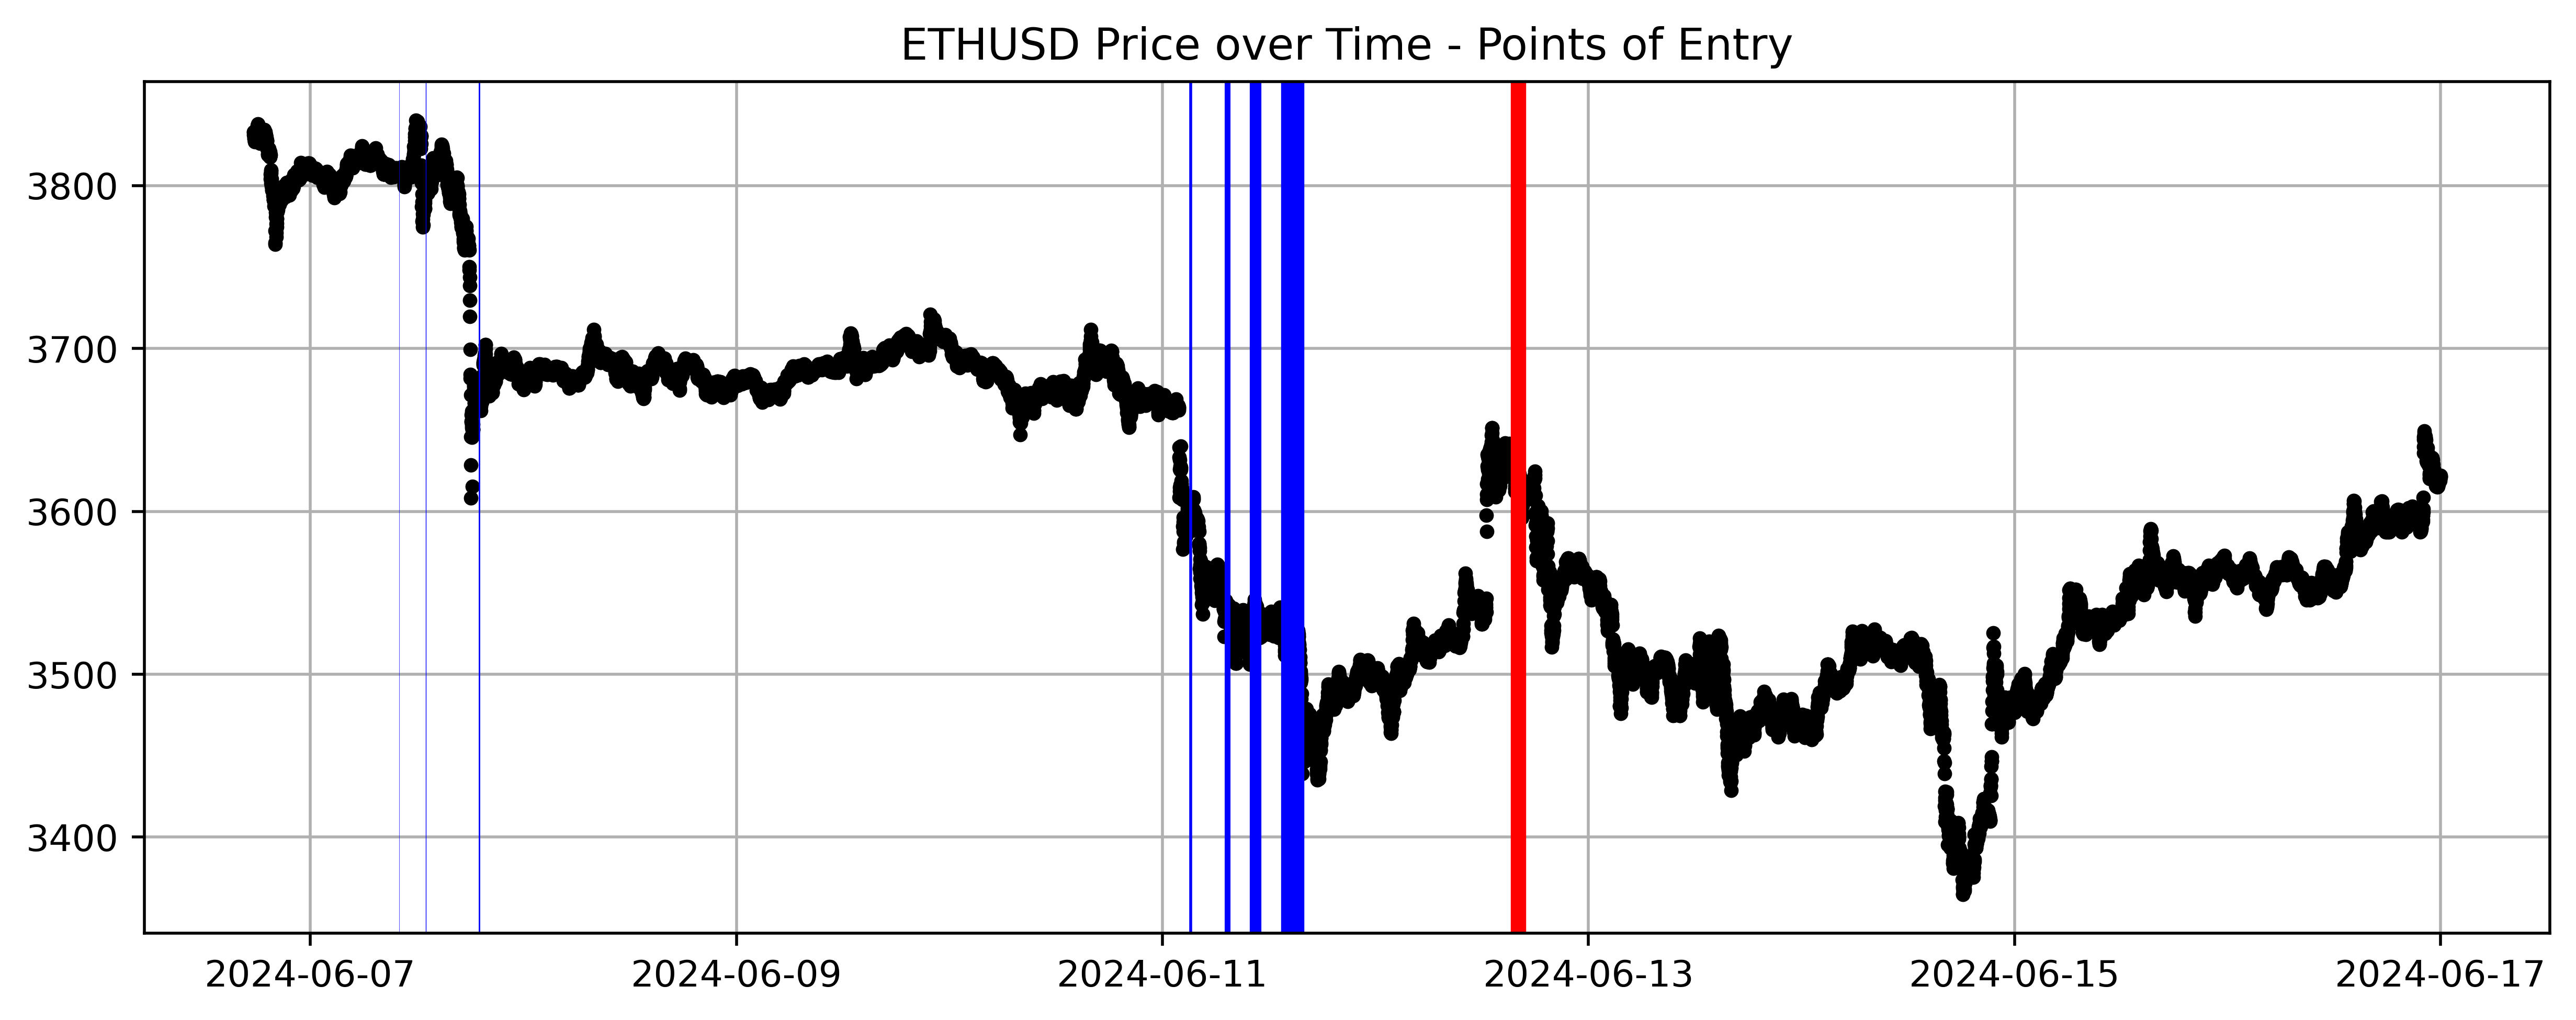
The following table shows the same information, with raw values representing the cumulative leverage on the position with each order:
| Order Type | Price | Processed Time | Leverage | Cumulative Leverage |
|---|---|---|---|---|
| LONG | 3809.3 | 2024-06-07 10:00:00+00:00 | 0.1 | 0.1 |
| LONG | 3805.65 | 2024-06-07 13:00:00+00:00 | 0.2 | 0.3 |
| LONG | 3675.99 | 2024-06-07 19:00:00+00:00 | 0.4 | 0.7 |
| LONG | 3604.25 | 2024-06-11 03:10:00+00:00 | 0.8 | 1.5 |
| LONG | 3540.16 | 2024-06-11 07:20:00+00:00 | 1.6 | 3.1 |
| LONG | 3541.04 | 2024-06-11 10:30:00+00:00 | 3.2 | 6.3 |
| LONG | 3515.48 | 2024-06-11 14:40:00+00:00 | 6.4 | 12.7 |
| FLAT | 3614.32 | 2024-06-12 16:05:00+00:00 | 6.4 | 19.1 |
Risk Management and Incentives on SN8
On SN8, miners are encouraged to pick a max drawdown (MDD) between 0.25% and 1.5% and stay below this threshold throughout their strategy. To enable this incentive, we use the risk-adjusted returns to score the quality of our miners. This approach normalizes a miner’s returns by their max drawdown. The underlying assumption is that a miner might proportionally increase their returns with increased leverage, which in turn would proportionally increase their max drawdown.
Our top miners generally manage their risk quite well, with competitive miners typically maintaining a drawdown of less than 1.5%. To achieve this, they usually make trades with less than 2x cumulative leverage, often staying below 0.5x. Here are recent trades from two competitive miners in the system, each with very different trading characteristics:
-
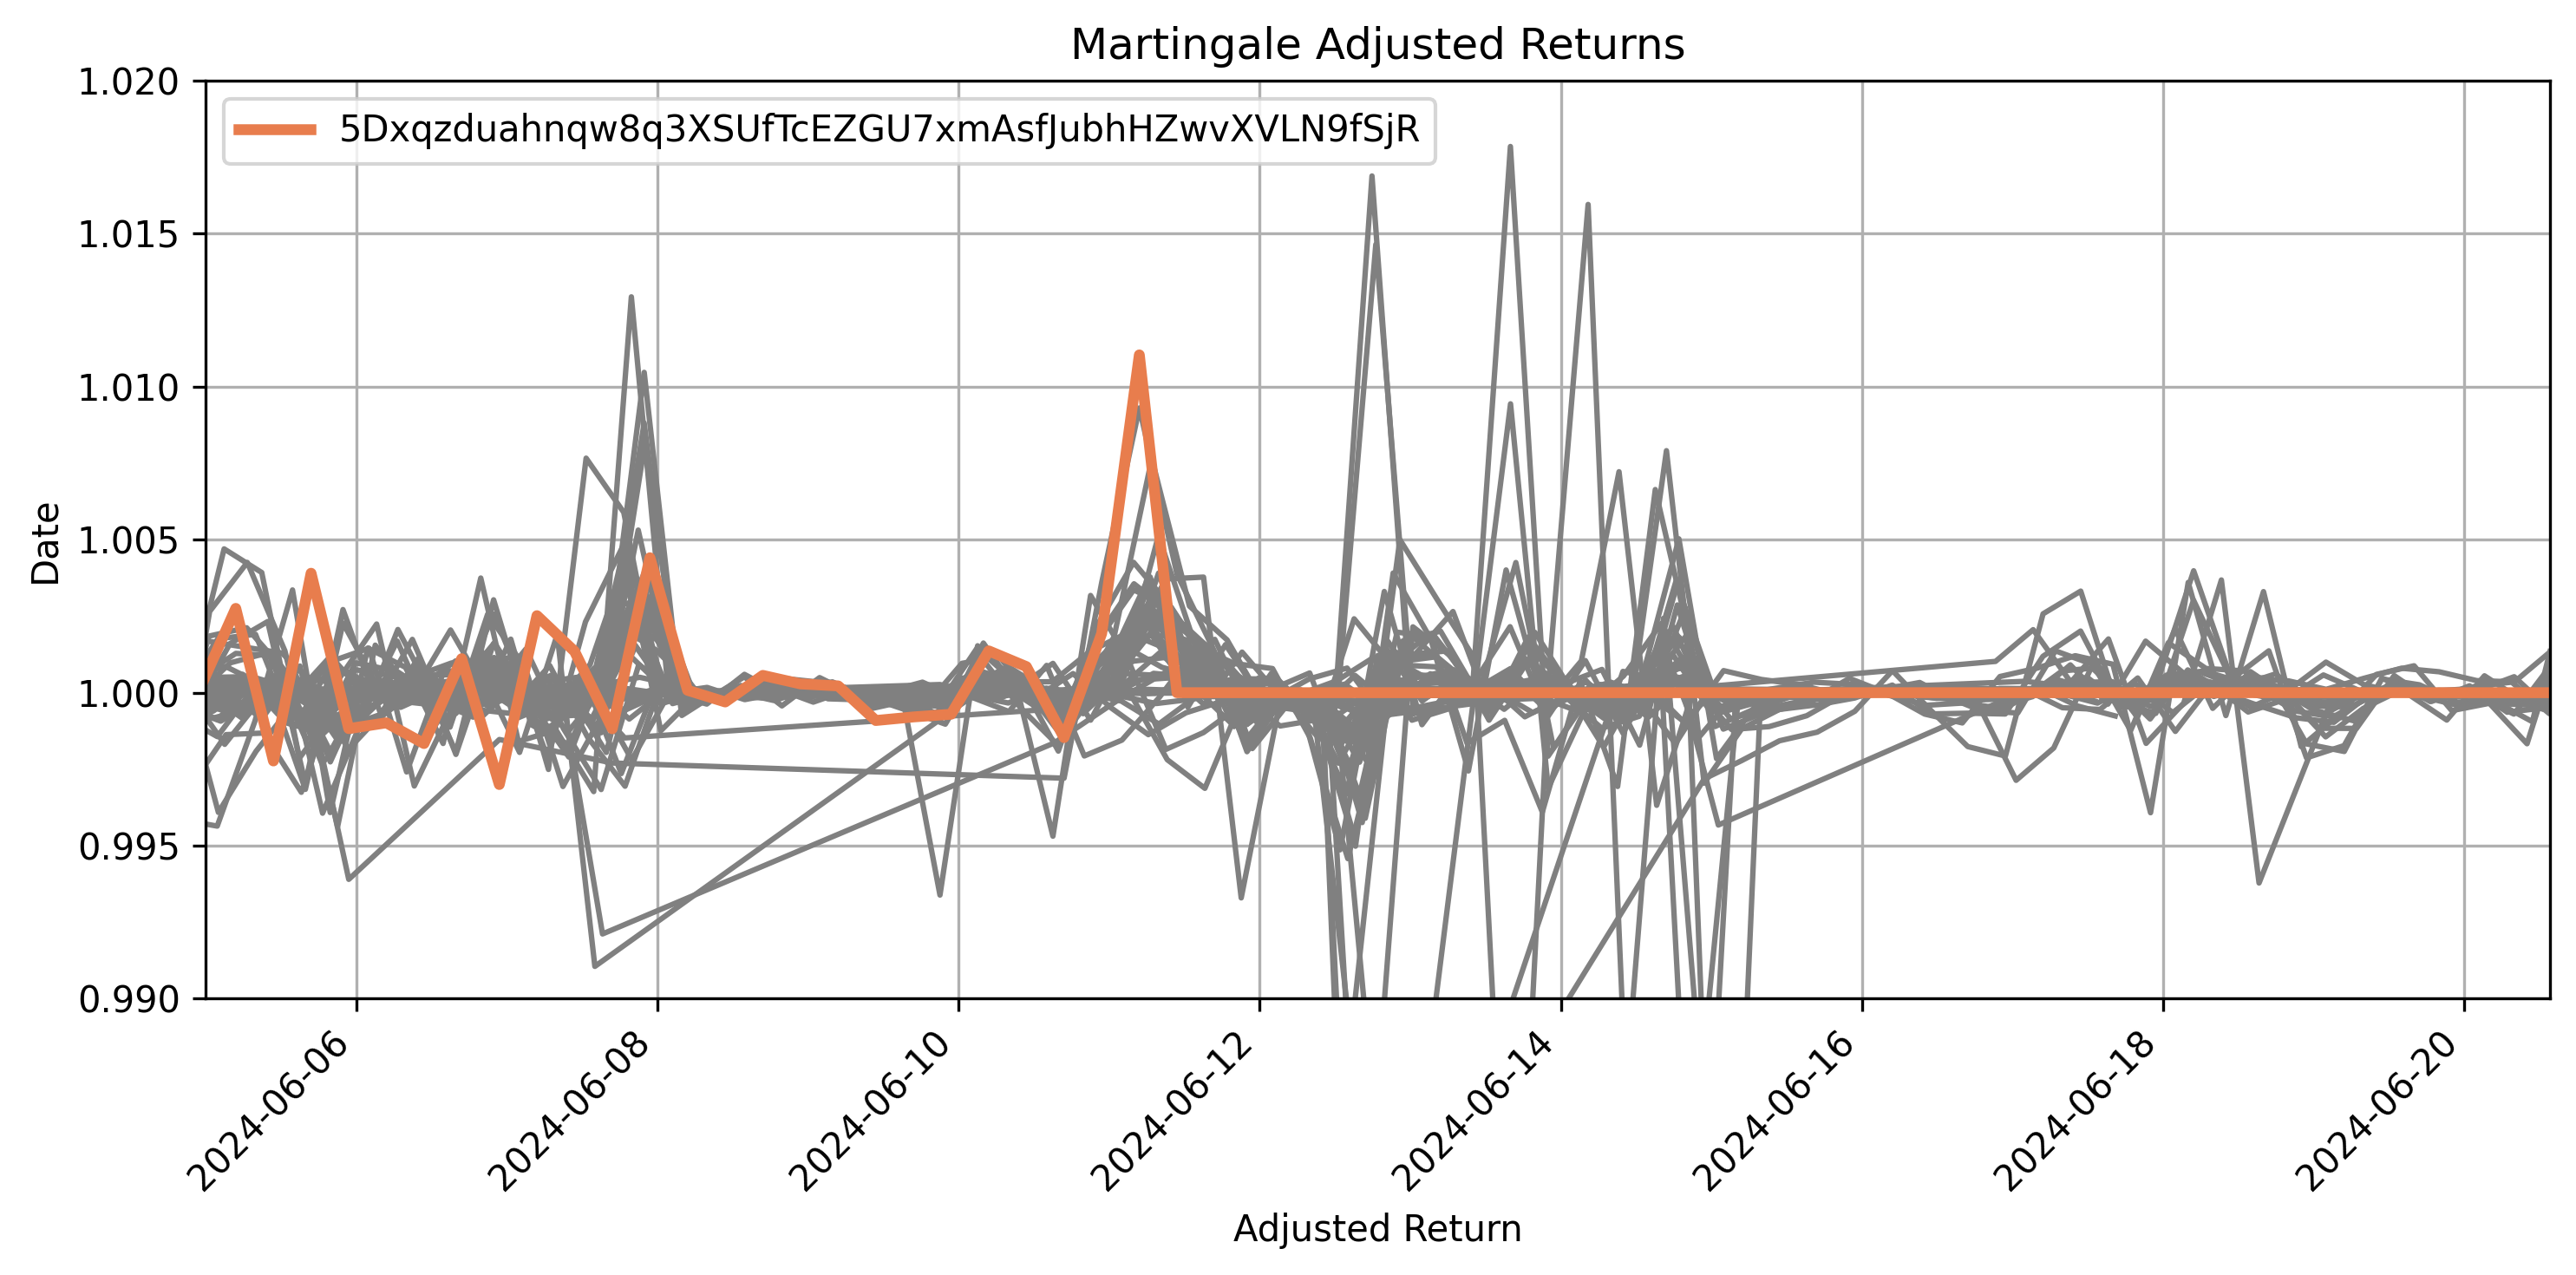
Miner 1 (5Dxqzduahnqw8q3XSUfTcEZGU7xmAsfJubhHZwvXVLN9fSjR): This miner makes frequent trades with small leverage over short time intervals. Their highest cumulative leverage utilization in the past week was from a BTC position opened on June 13 at 22:57 and closed on June 14 at 5:40, with a peak leverage of 0.6x. Their returns are low at 1.43%, but their max drawdown is also low at 1.18%, giving them an effective risk-adjusted ratio of around 1.2.
-
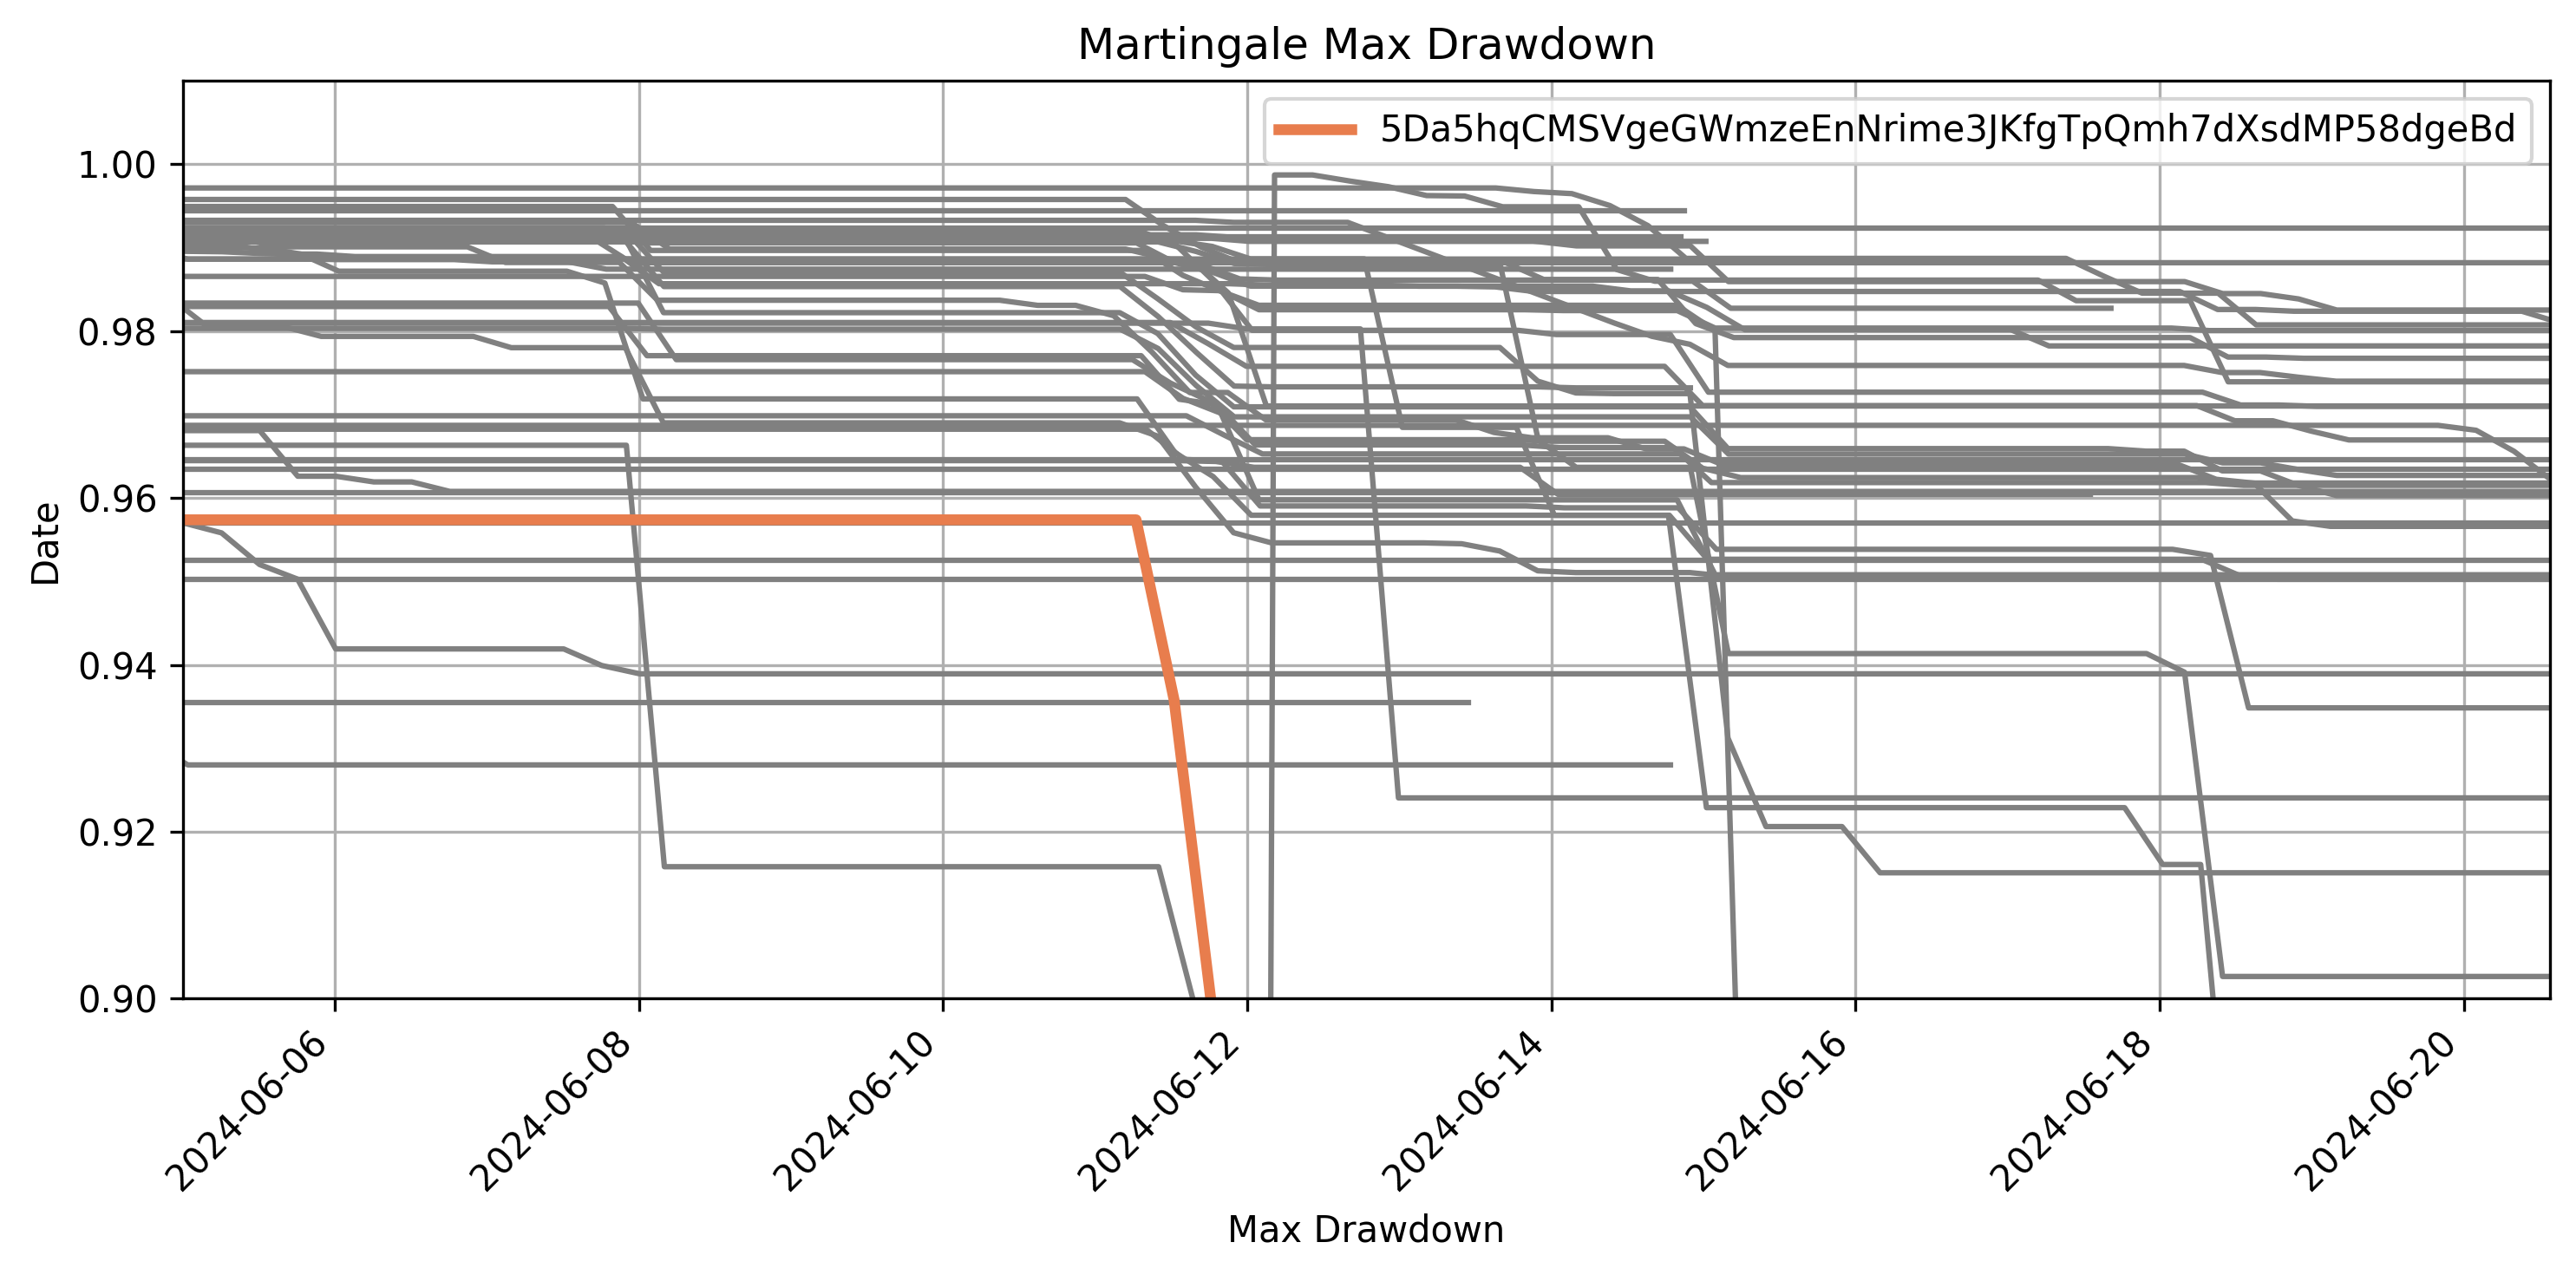
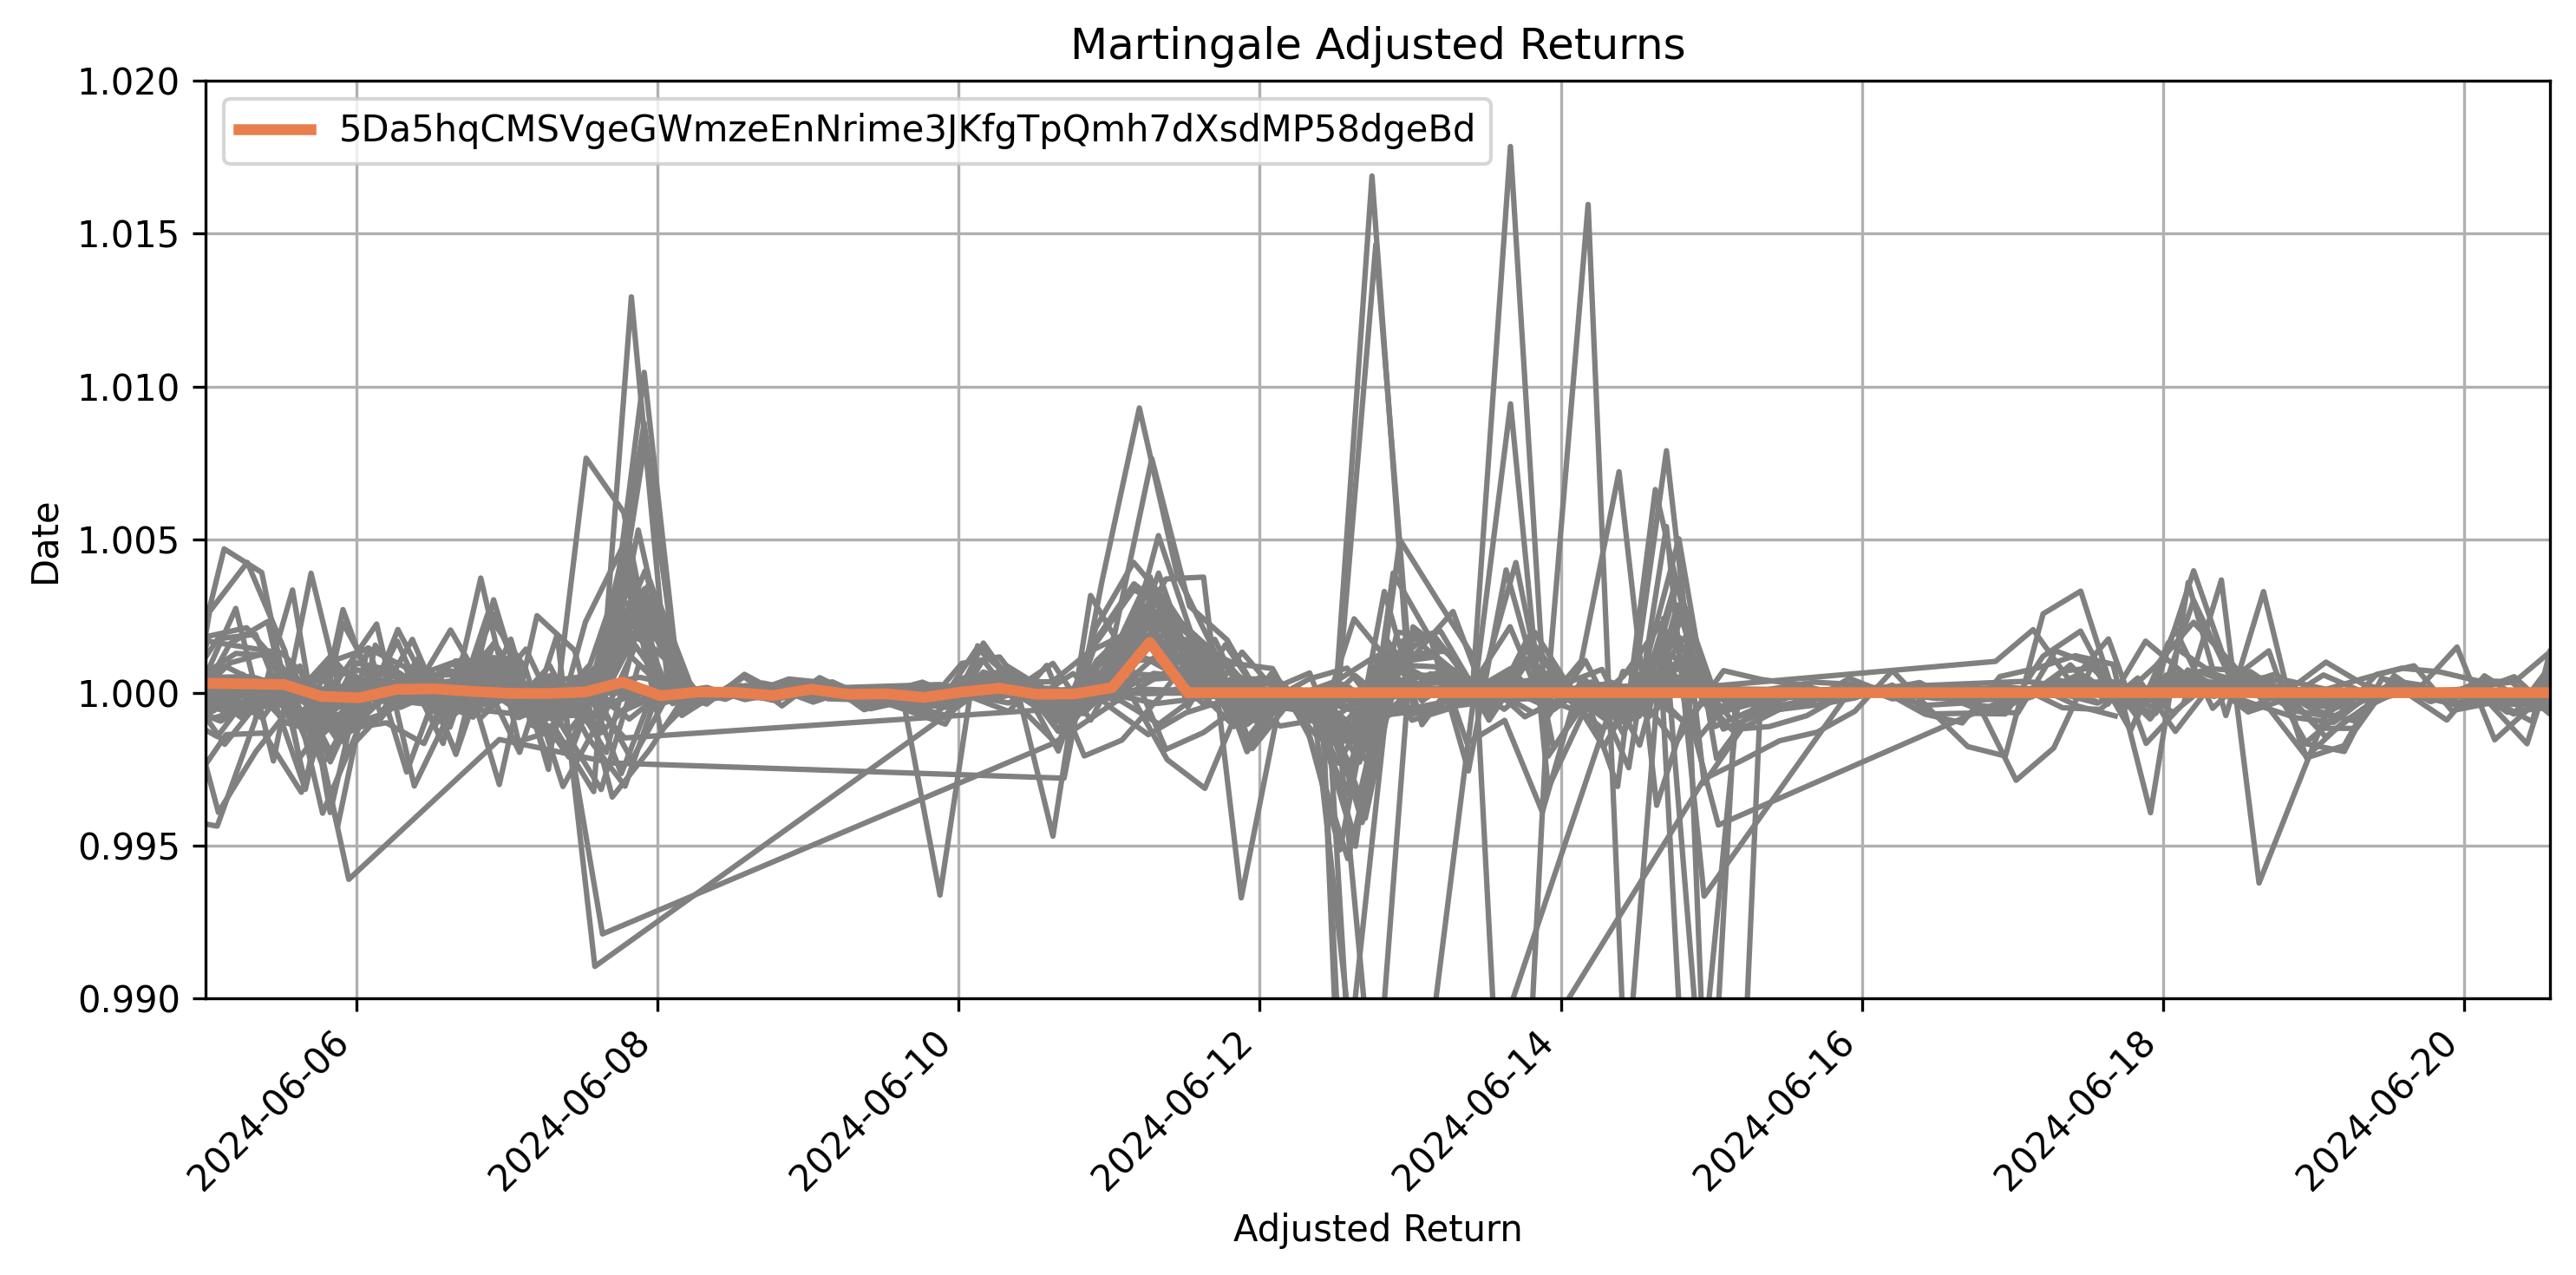
Miner 2 (5Da5hqCMSVgeGWmzeEnNrime3JKfgTpQmh7dXsdMP58dgeBd): This miner also trades frequently but generally with higher leverage. Between June 12 and June 20, they maintained multiple positions with a cumulative leverage of 1x, the largest being 1.5x on EUR/USD. As they primarily trade forex, this level of leverage utilization aligns with the risk tolerance we typically observe on our platform when translated to other asset classes like crypto. This miner took some big positions before the current risk-adjusted returns policy was implemented, resulting in both big returns and big drawdown. Within the past month, the miner captured 8.9% returns on a 4.26% drawdown, resulting in an effective risk-adjusted ratio of 2.1.
Miners using higher leverage receive an additional penalty in our system to encourage them to stay below 5% drawdown. With a 4.26% MDD, our second miner incurs a steep penalty, making them much less competitive than their risk-adjusted ratio would suggest. As of June 20, 2024, this miner appears to have reduced their leverage and will likely become more competitive in the coming weeks.
Simulating the Impact of Martingale Strategy
If adopted as a strategy, the Martingale position described above would affect miners differently depending on their prior trades. To demonstrate this, we will clear all real positions for a selected miner’s trade pair beyond a certain point and simulate the use of a Martingale strategy. We can then reconstruct the miner’s checkpoints second-by-second and rerun scoring to examine its impact on the miner’s behavior within the system.
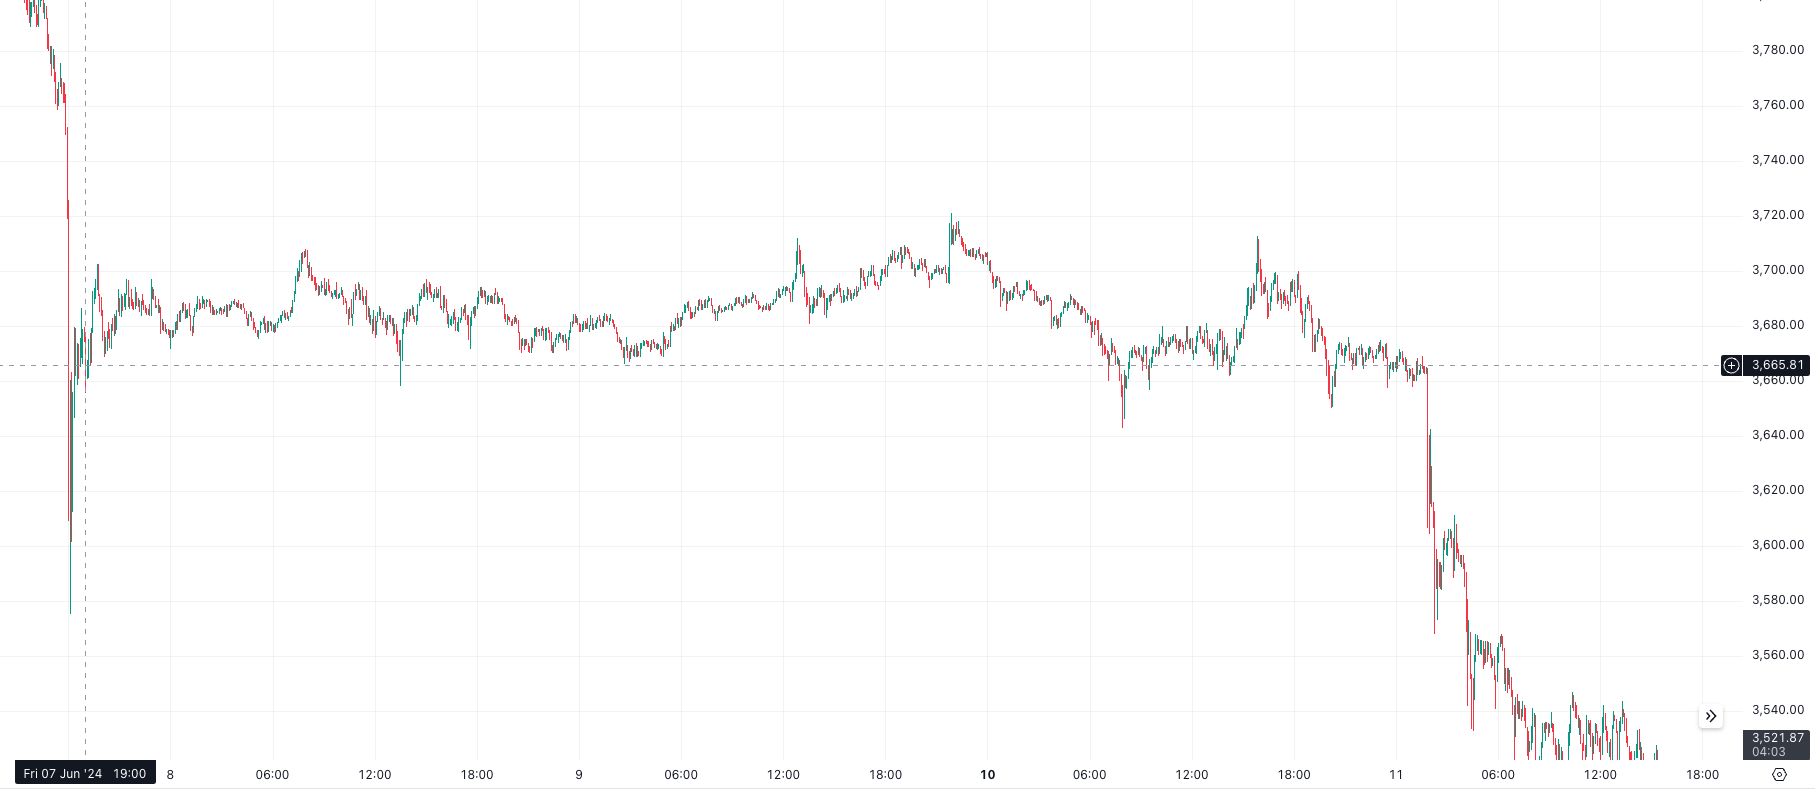
To provide additional context as to how SN8 captures returns on a miner’s position prior to shedding them for erratic leverage usage, the initial entry points for this simulated Martingale approach are placed before market upswings. This allows positive gains to be injected into the miner’s checkpoints. This plot depicts the tracked price of Ethereum between June 7th and June 11th:
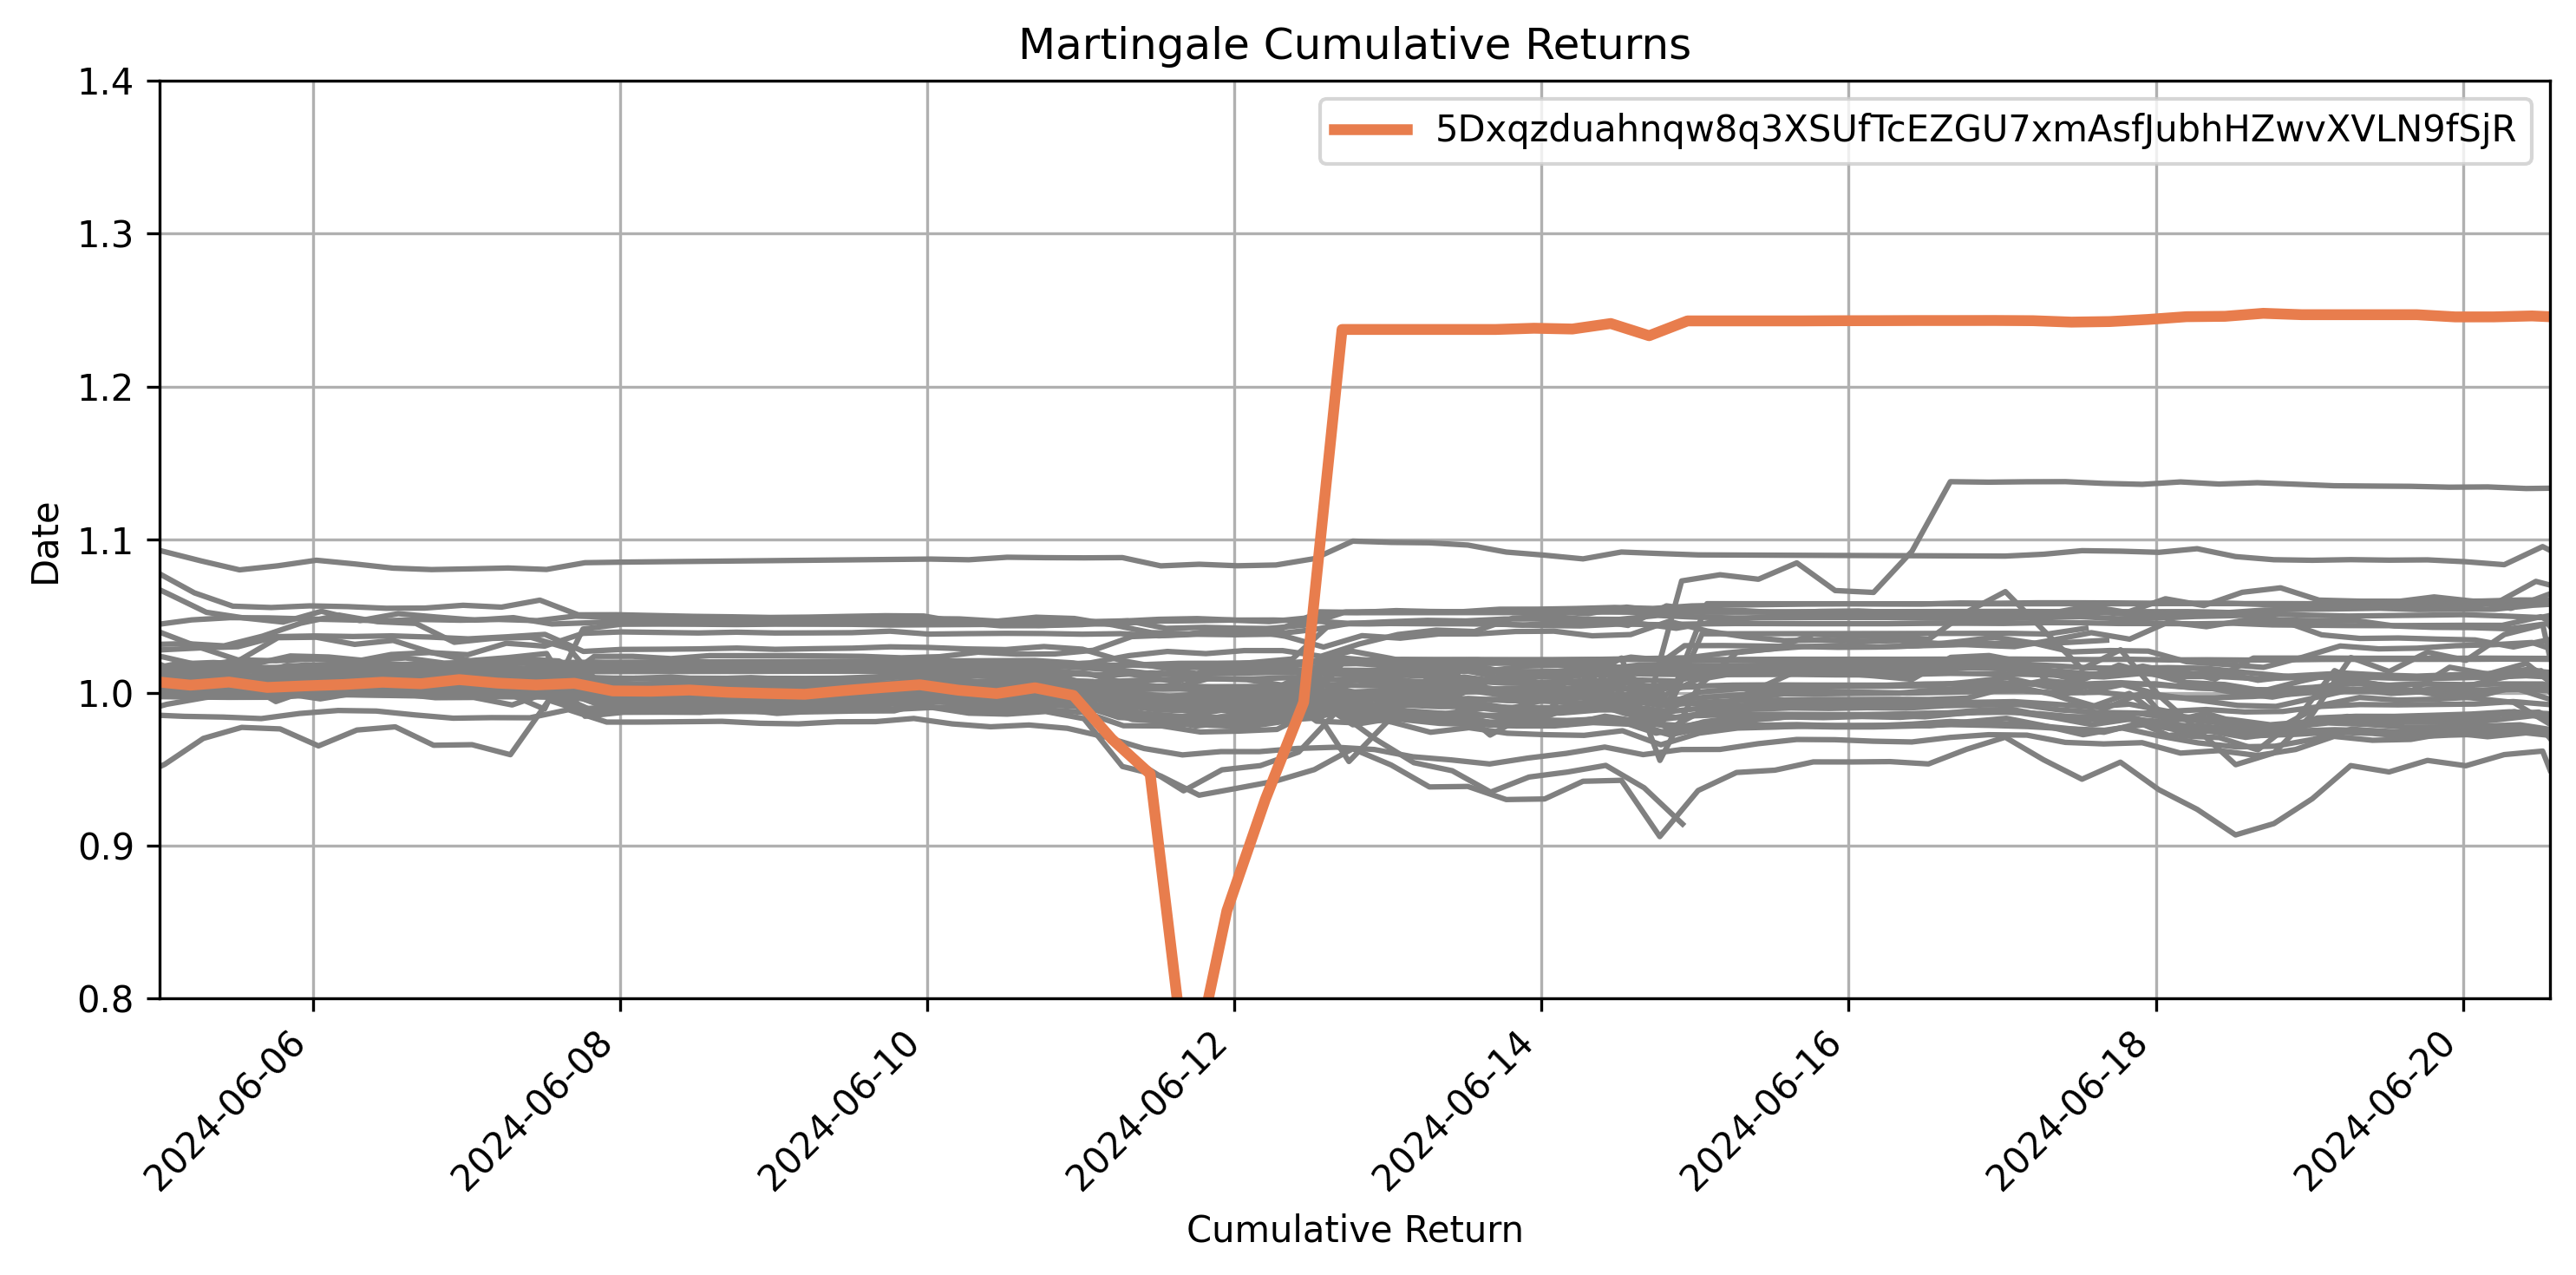
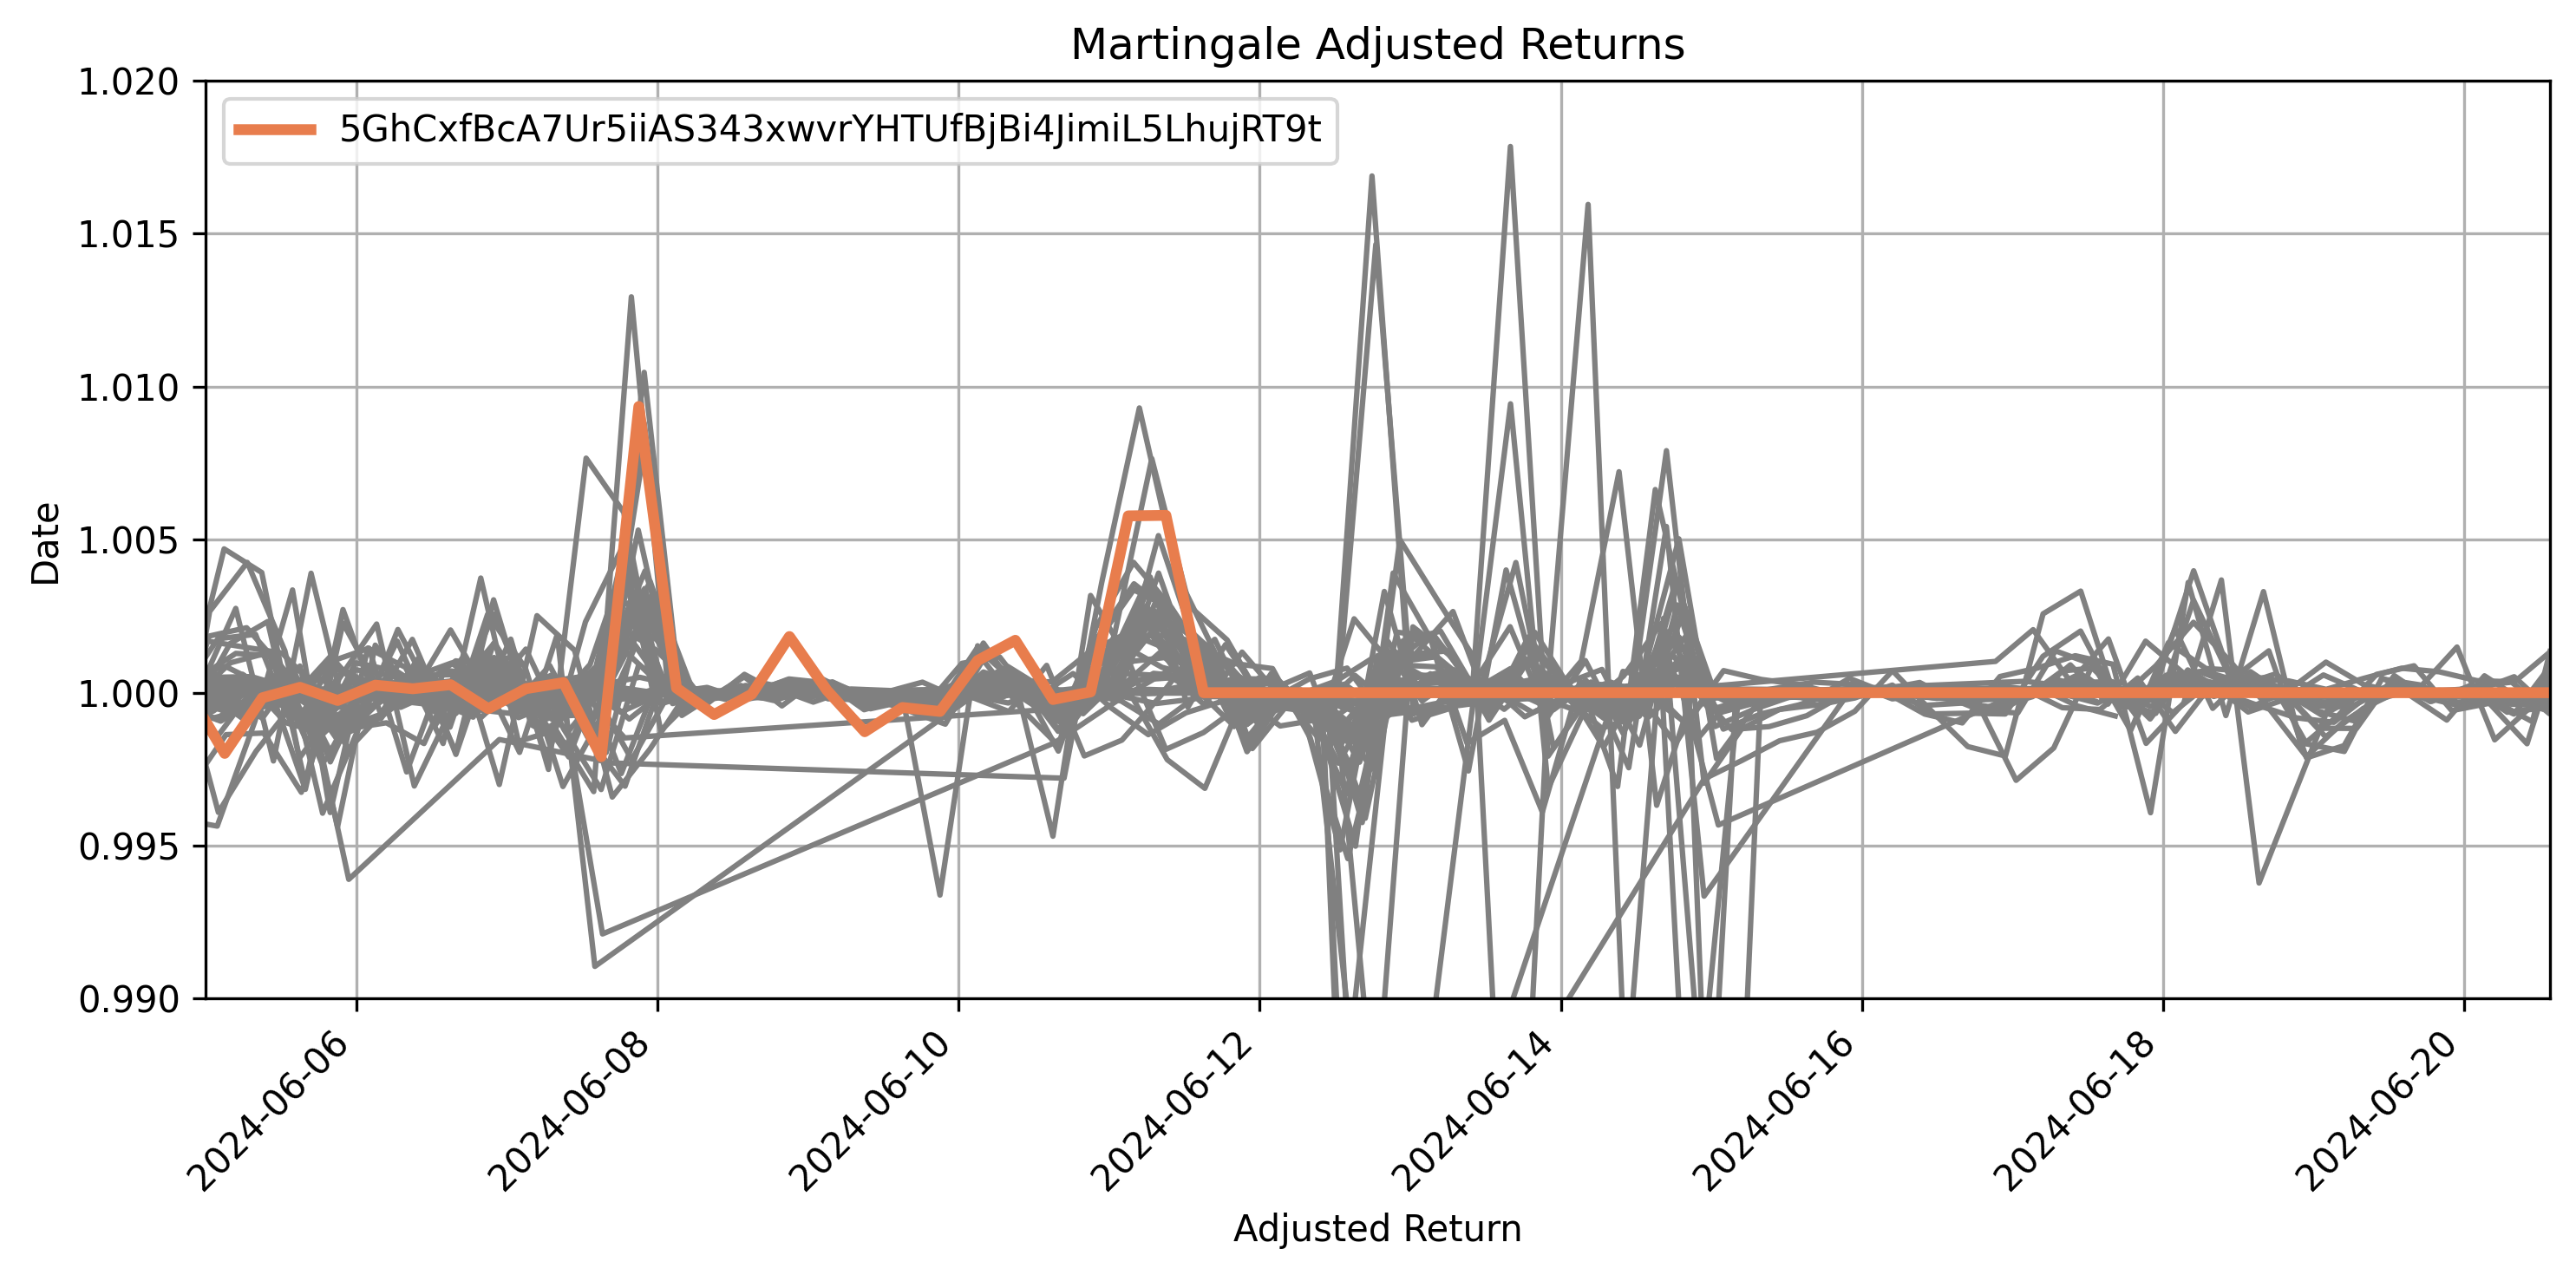
In each of the following plots, a single miner’s behavior will be depicted as a colored line. All other miners in the system will be depicted as a grey lines in the background to provide context for their relative performance.
Miner 1 Simulation (5Dxqzduahnqw8q3XSUfTcEZGU7xmAsfJubhHZwvXVLN9fSjR)
In the plot below, we can observe the miner’s cumulative returns as simulated by the Martingale approach. It is evident that the Martingale position incurs substantial losses before acheiving significant gain on the 13th.
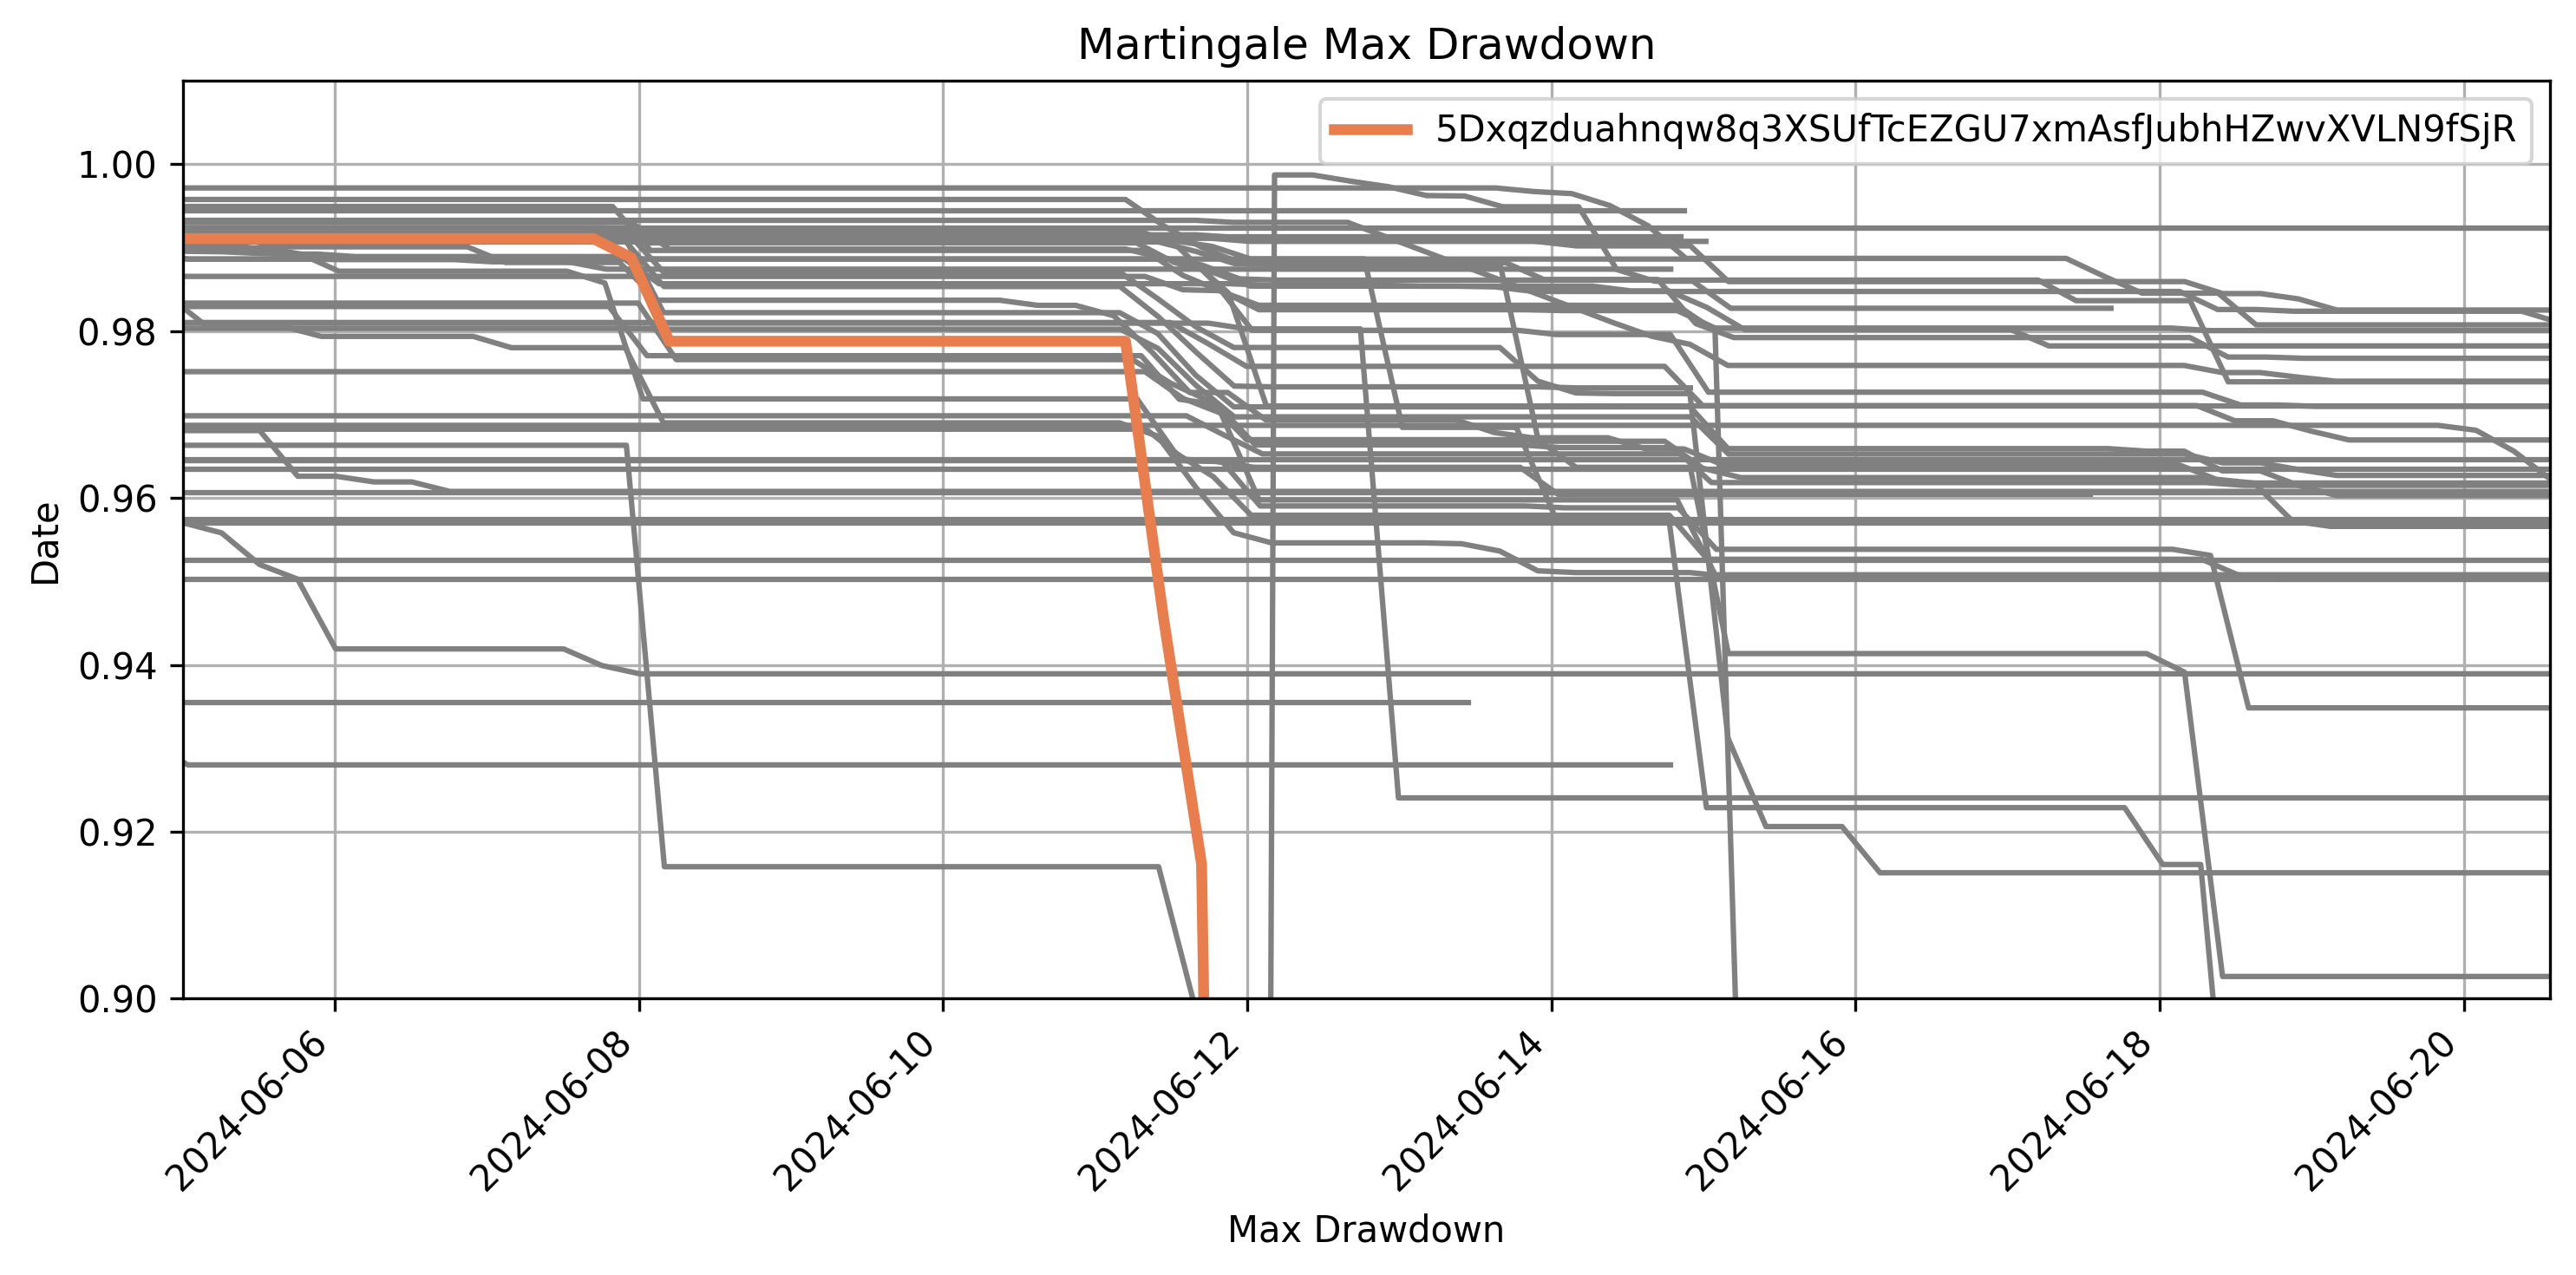
Although this miner generally has low returns, their max drawdown is also typically quite low. The following plot visualizes their max drawdown, allowing us to interpret how the Martingale position impacts the max value up to the point.
The ratio of return to drawdown determines the weights of the miner in our system. Every six-hour interval on the checkpoints object captures the second-level gains and losses on the miner’s portfolio based on open positions. We visualize the margins of each interval, representing the return on that interval. Adjusting for the drawdown penalty, we can visualize what resembles the miner’s vote on the network model. SN8 uses exponential decay, so the highest augmented returns dominate the voting process.
Initially, the miner demonstrates an impressive ratio of returns to risk until June 7, when they first opened the Martingale position. They incur significant initial loss on this position, which increases their effective drawdown used for the risk adjustment. Consequently, this drops them from a top 5 miner to a top 15 miner based on risk-adjusted returns, dramatically reducing their influence in a network strategy. The miner tracks a substantial gain on this position while maintaining a 2% max drawdown, which provides greater augmentation as this position sets a new benchmark for their max drawdown. However, when the miner tries to average into a position on the 11th, their drawdown exceeds 5%. Their subsequent drawdown penalty effectively removes their influence on the system by setting their incentive to 0 for at least 30 days.
In summary, for small leverage traders, this miner’s position was identified as potentially erratic on June 7th, leading to an increased penalty. In increasing the miner’s penalty, the miner’s influence of the miner on the network model is greatly reduced. This demonstrates that the system is capable of shedding major systemic risk, as it avoids the worst potential impacts of the 20% MDD from the martingale through proper incentive management.
Miner 2 Simulation (5Da5hqCMSVgeGWmzeEnNrime3JKfgTpQmh7dXsdMP58dgeBd)
Due to their prior high leverage, this miner is insulated from drawdown increases resulting from the initial average-in. In effect, the “normal” behavior for this miner is defined by any drawdown below 4.26%, meaning that this initial average-in does not affect the miner. This is evident by examining the max drawdown values at each checkpoint, which remain unchanged until the 11th when new high values are reached.
However, due to their steep existing penalty, the miner already struggled to be competitive and did not have substantial network incentive. The increased leverage on the 11th further escalated the drawdown for the miner beyond 5%, resulting in the complete loss of returns, effectively sidelining them for a month until this high drawdown was resolved from their checkpoint.
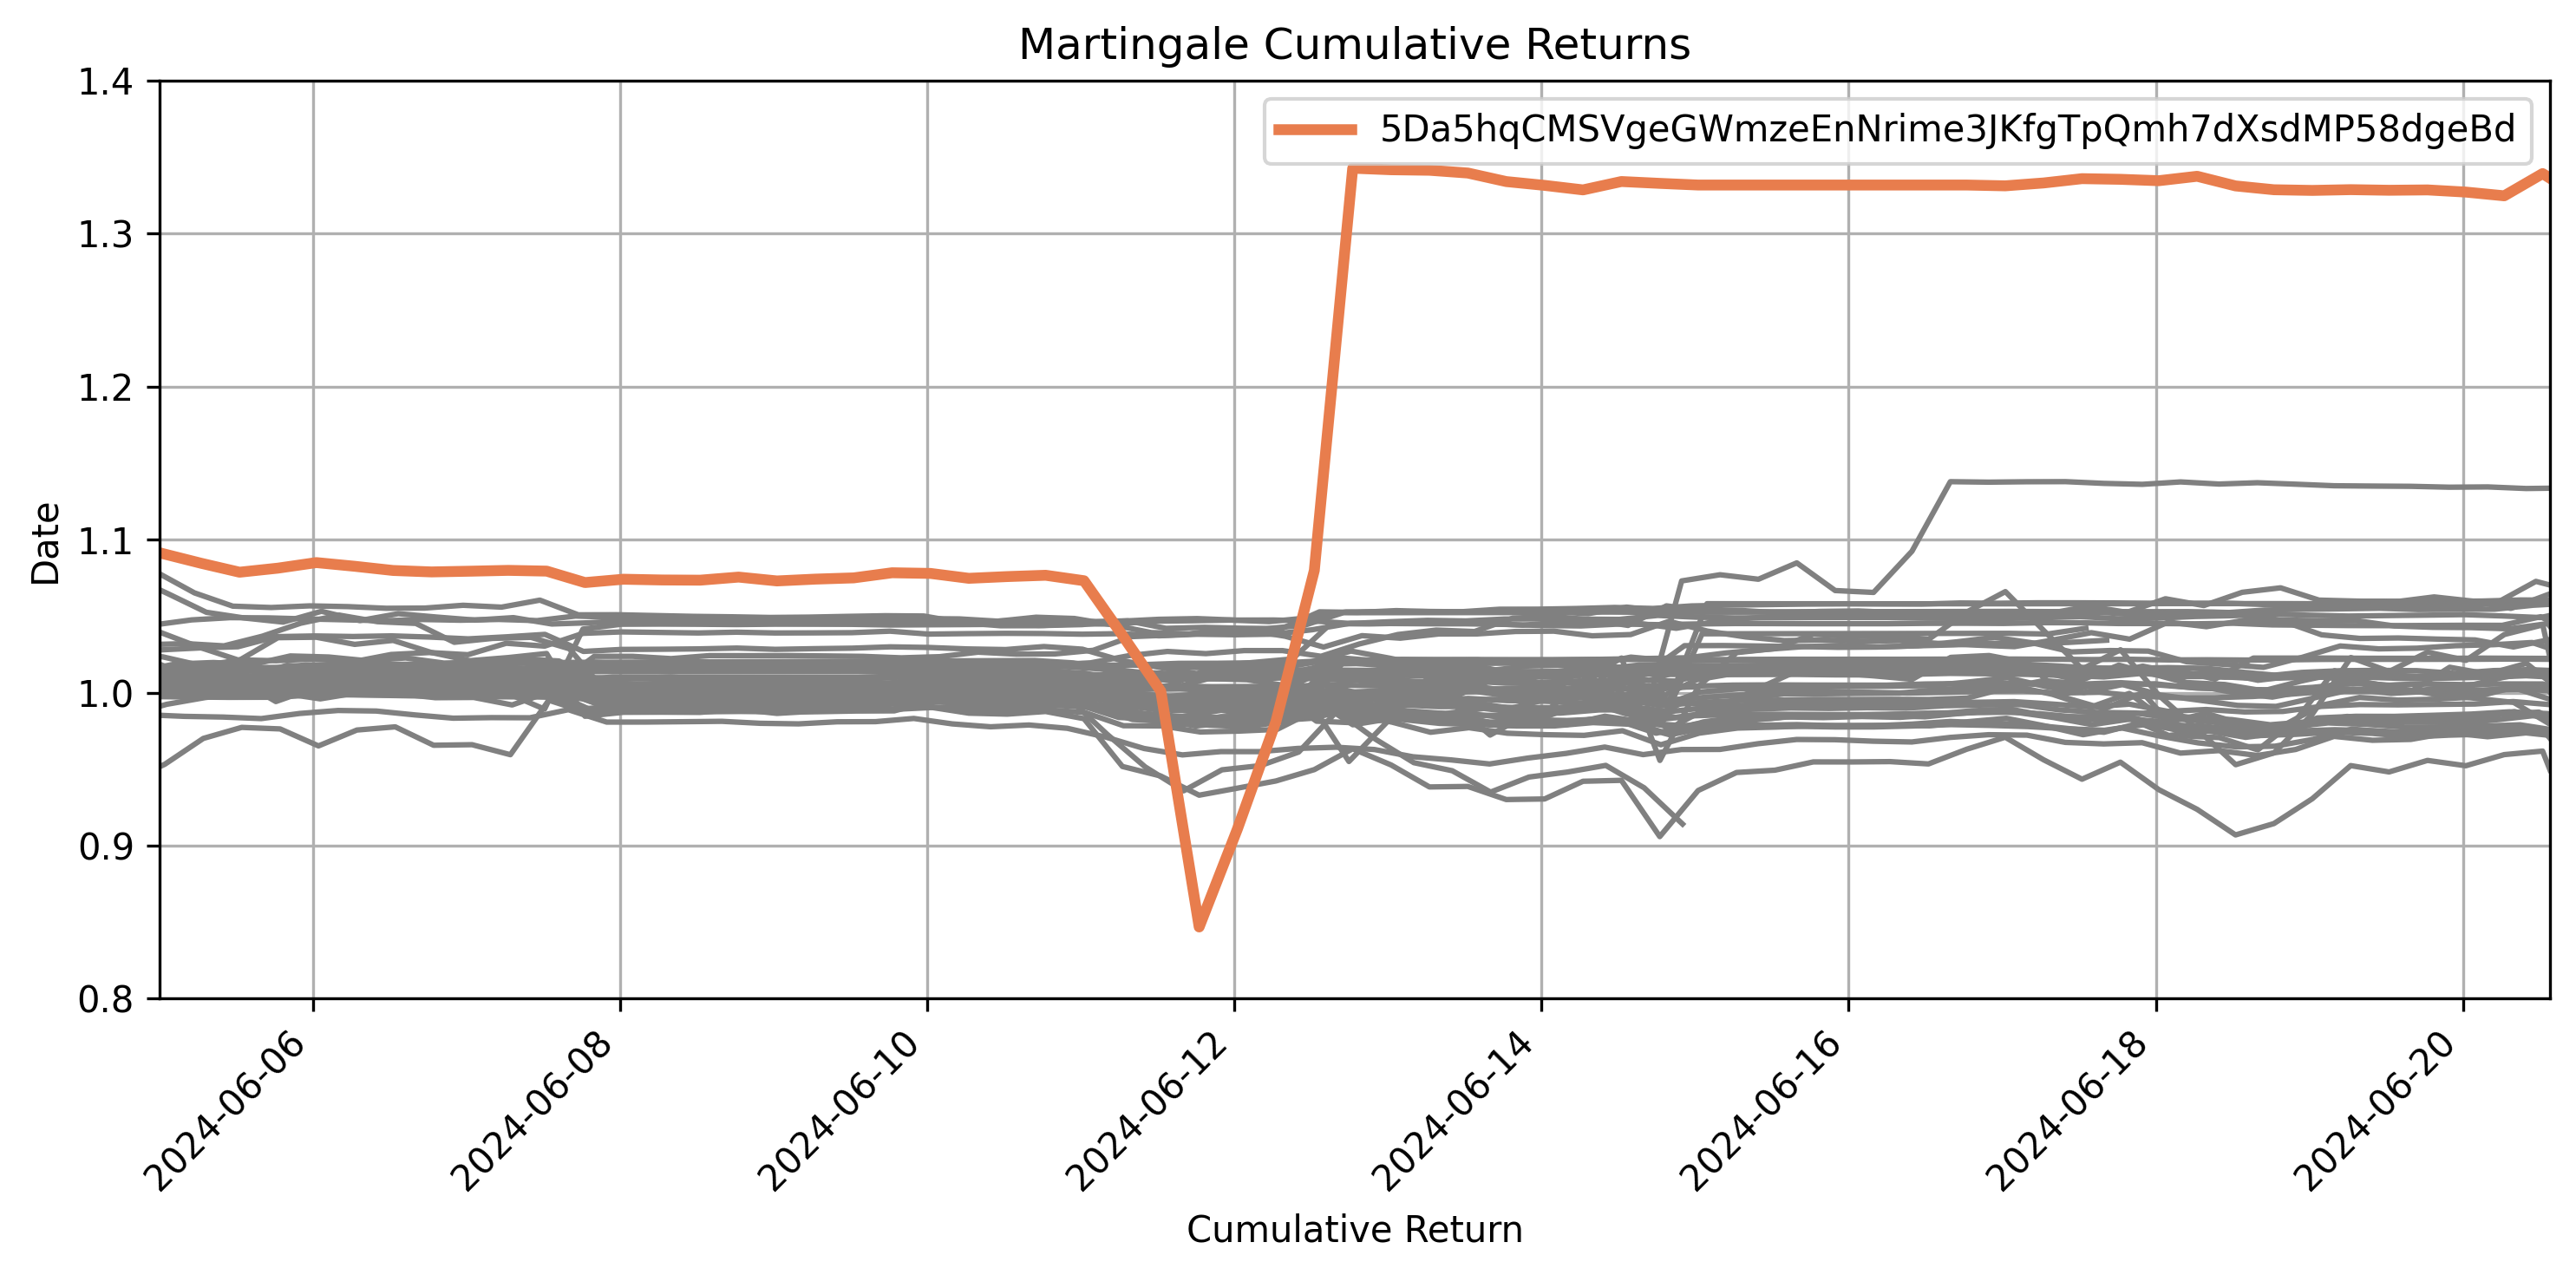
For perspective, this is the portfolio value trajectory the miner would have tracked in our system without a penalty for drawdown:
Tarvis
To provide a comprehensive view, let’s explore how a Martingale position would impact our miner, Tarvis. Tarvis is generally a low drawdown miner, and therefore is sensitive to changes in max drawdown. Consequently, the introduction of this Martingale position has an almost immediate impact on Tarvis’ drawdown and resulting risk-adjusted return.
The margins on Tarvis immediately drop Tarvis to 0, indicating that Tarvis no longer maintains voting power on the network model. Simultaneously, the system does not flag the initial Martingale behavior as abnormal, given its low drawdown relative to Tarvis’ historical pattern. This allows Tarvis to capture the full value of the gains until June 11th when it is pruned from the network.
Conclusion
The behavior of miners can vary significantly, bringing a dynamic quality to our system. Erratic or irresponsible leverage usage may be defined differently for miners based on their historical trading behavior. This is demonstrated by the high leverage miner, who is less impacted by the initial average-in as it could be classified as normal behavior. However, in all cases, miners are not competitive when utilizing a Martingale approach, due to its impact on their drawdown and consequently their effective score in the system. Even with the preliminary entry into Martingale using low leverage, none of the miners remain in the top 10. The Vanta Network model integrates a combination of top miner positions. Therefore, when a miner’s incentives decline, their influence on the overall network model also diminishes to zero, with other leading miners stepping in to take over. This article demonstrates through historical simulation that even our top miners, each with different trading characteristics, would be pruned from the network if they adopt erratic risk in drawdown. This safeguards the network model, while allowing us to capture gains by miners prior to abnormal behavior.
Ultimately, the implementation of the Martingale strategy resulted in a dramatic pruning of miners from the system. Despite achieving substantial returns upon closing their positions, none of the miners remained competitive. The relentless drawdowns incurred by this risky approach nullified any potential gains, effectively sidelining these miners from the top ranks and diminishing their influence on a network-based model.