Softmax Scoring Distribution
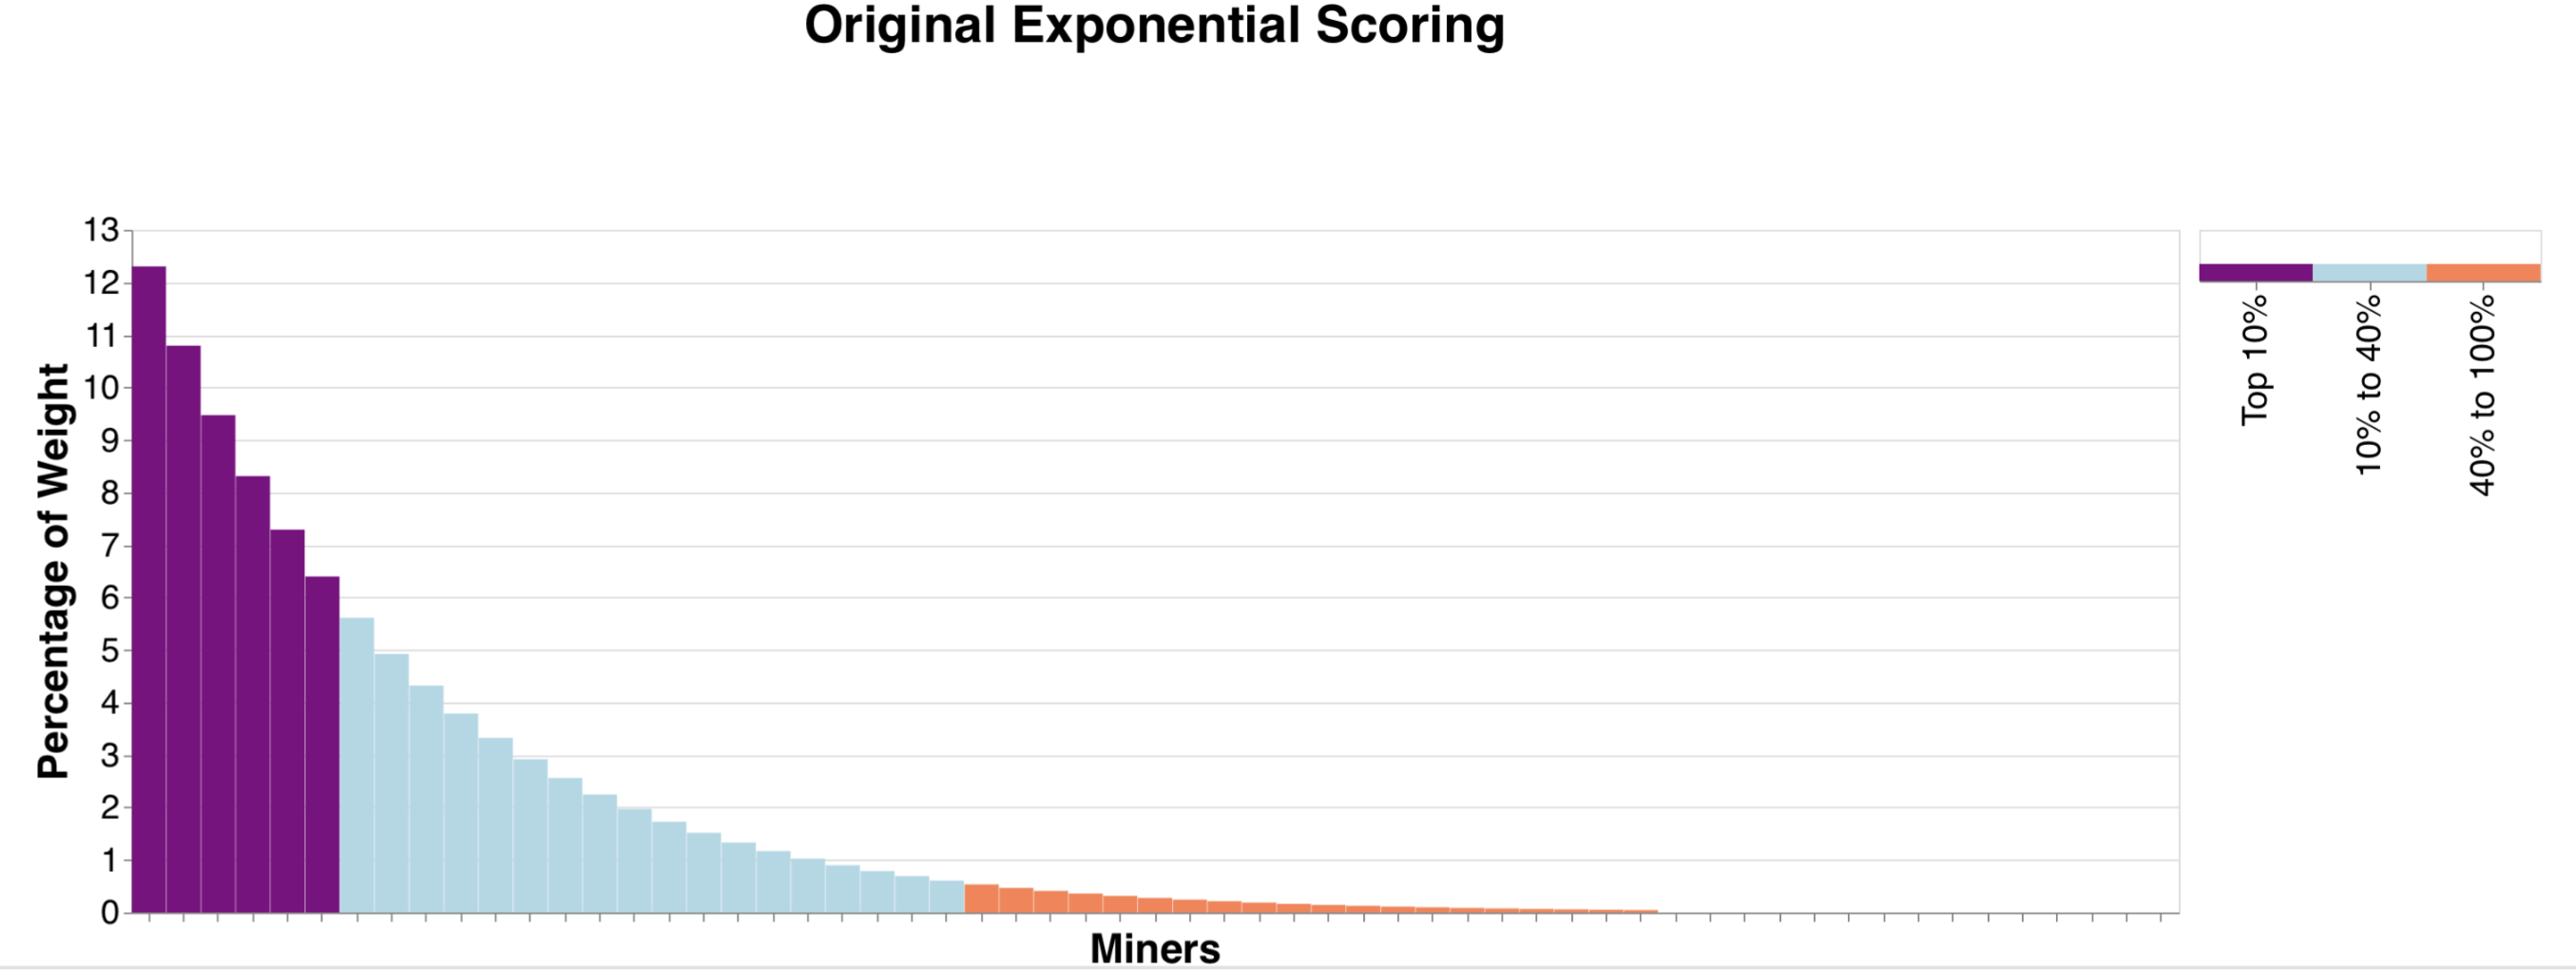
The current scoring distribution uses exponential decay to spread incentive amongst top miners. Depending on the number of miners in the system and their ranks, this will distribute the vast majority of emissions to the top miners. We have targeted a distribution of 90% of emissions to the top 40% of miners. The current iteration of exponential decay incentivizes top miners and encourages competition at the top of the rankings, generating healthy growth and competition on Vanta Network thus far. The exponential scoring implementation may be found here.
Problem Statement
The miner’s overall rank is the only input to the decay distribution. This results in the following issues:
- A small group of top miners with much higher relative performance than the rest of the network won’t receive dynamic emissions.
- Consider two networks each with five miners. Network A has two miners with high scores, and the other three have very low scores. Network B has all five miners with scores near 0.5. The distribution of emissions is the same in both networks.
- An increase in score for the top miner doesn’t result in an increase in emissions for that miner.
- Miners with similar scores may not receive similar amounts of incentive.
With the ultimate goal of achieving high-quality network output, incentivizing the best-performing miners to further improve their models is a top priority. If the top miner improves, the final network output will also improve. If the top five miners are contributing significantly more to the final network output, they should receive significantly more emissions.
Proposed Changes
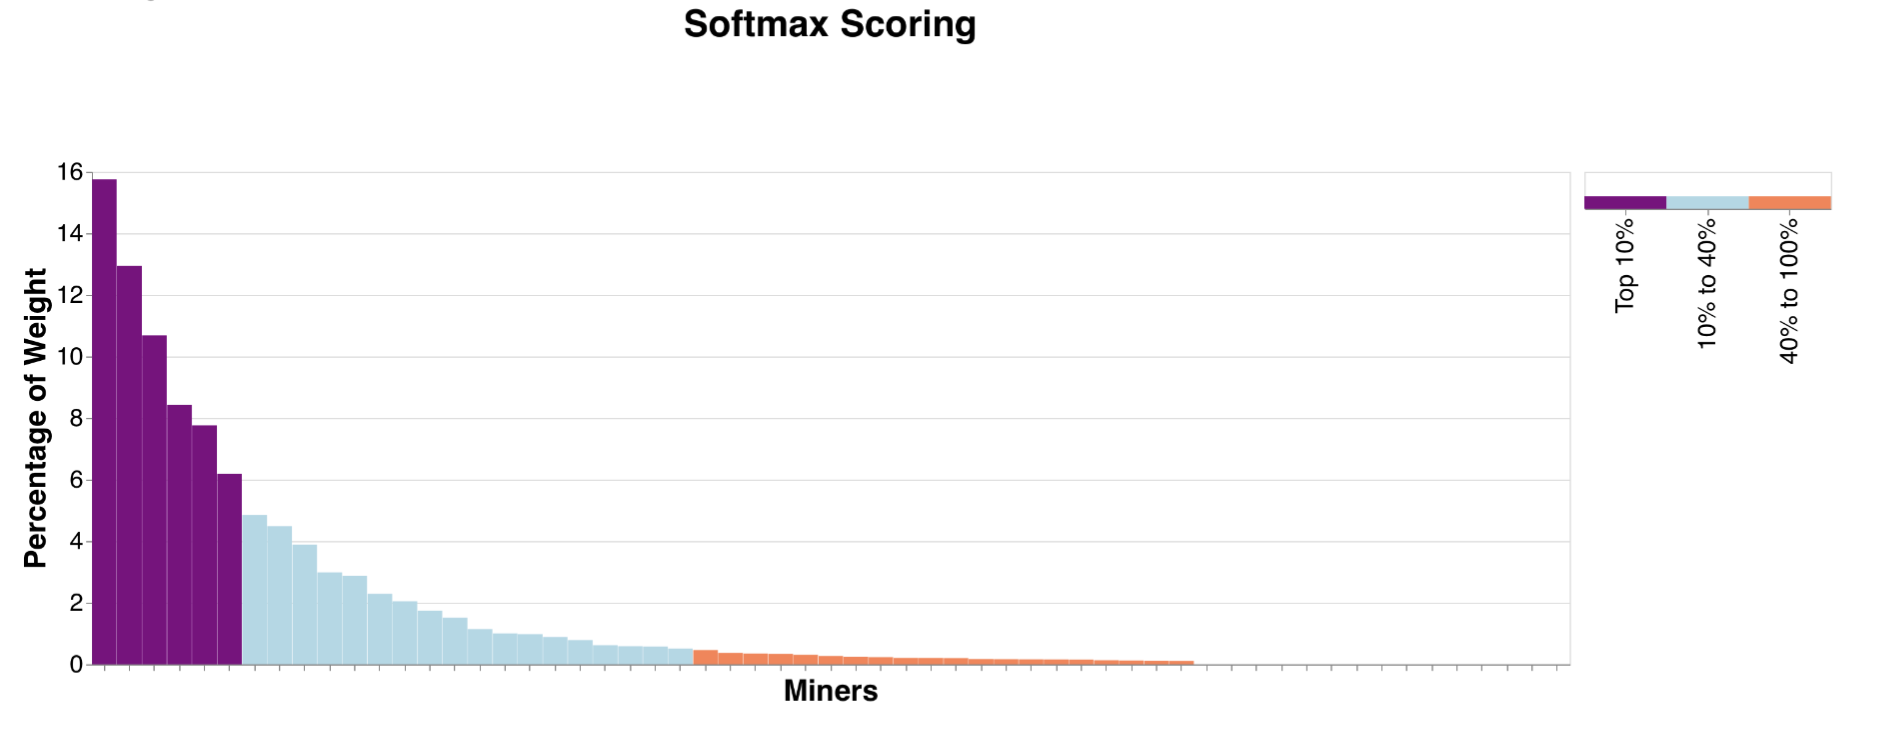
We propose the use of the softmax function, which computes weights based on relative performance of each miner, instead of their discrete ranking. As its name implies, the softmax function is a fuzzy approximation for the maximum, such that a majority of emissions will still go to the top performers. We can further fine-tune this distribution through the use of a temperature parameter which is discussed in the next section.
By using a softmax function with a lower temperature that distributes based on the scores of miners, the above issues will be remedied. Increases in the score for the top miner will result in increases in emissions, and miners that score similarly will receive more balanced incentive. This will also shift a higher percentage of emissions to the top miners if their relative performance to other miners is significantly higher. Distributing more incentive to the top performers incentivizes improvement in quality of the final network output. In the graphs below, it can be seen that the top 10% of miners are receiving 56% of emissions with softmax.
Temperature
We propose a temperature value of 0.2 which balances between incentivizing the top miner and still distributing emissions to other top miners that contribute to the final output of the network. Too low of a temperature value (e.g. less than 0.1) consolidates the distribution on the top one or two miners, while too high of a temperature value (e.g. greater than 0.5) more closely resembles a uniform distribution. The former wouldn’t properly incentivize the other top miners, and the latter would provide a disproportionate amount of emissions to less effective miners.
Examples
Tables
By comparing the tables below, it can be seen that exponential return is static for changes in returns while softmax adjusts weight more reasonably.
| Miner | Return Before Scoring Function | Softmax Return | Exponential Return |
|---|---|---|---|
| A | 0.9 | 0.495 | 0.855 |
| B | 0.9 | 0.495 | 0.125 |
| C | 0.1 | 0.009 | 0.018 |
| Miner | Return Before Scoring Function | Softmax Return | Exponential Return |
|---|---|---|---|
| A | 0.9 | 0.866 | 0.855 |
| B | 0.5 | 0.117 | 0.125 |
| C | 0.1 | 0.015 | 0.018 |
Graphs of Current State of Vanta Network
The graphs below are for the current miner returns as of 9/18/24. The softmax function takes more dynamic steps corresponding to the miner returns rather than static exponential steps. Each scoring function maintains the rank of values, so each pair of bars (same position on x-axis) below corresponds to the same miner. The table below shows the percentage of emissions given to each top percentage of miners:
| Scoring Distribution | Top 10% | Top 25% | Top 40% |
|---|---|---|---|
| Softmax | 0.56 | 0.87 | 0.95 |
| Exponential Decay | 0.48 | 0.84 | 0.95 |


Timeline
Proposal Delivery: September 19, 2024
PR: September 19, 2024
Implementation: September 26, 2024