System Updates - Scoring and Return Weighting Changes
This proposal outlines upcoming improvements to our scoring and weighting system, focusing on incentive distribution and return influence calculations. While the current system has been effective, we believe these changes will enhance miner performance, improve system stability, and simplify the scoring process while making the miner scores interpretable and fair.
Problem Statement
Our current system faces several challenges:
- The softmax temperature of 0.06 creates an overly steep incentive curve, concentrating emissions too heavily among top miners
- The dual-category recency weighting (90-day lookback and recent Calmar ratio) adds unnecessary complexity
- The recent penalty’s impact on overall scoring is insufficient to ensure ongoing signal contribution
Proposed Changes
To address these challenges, we propose the following changes to the scoring and weighting systems:
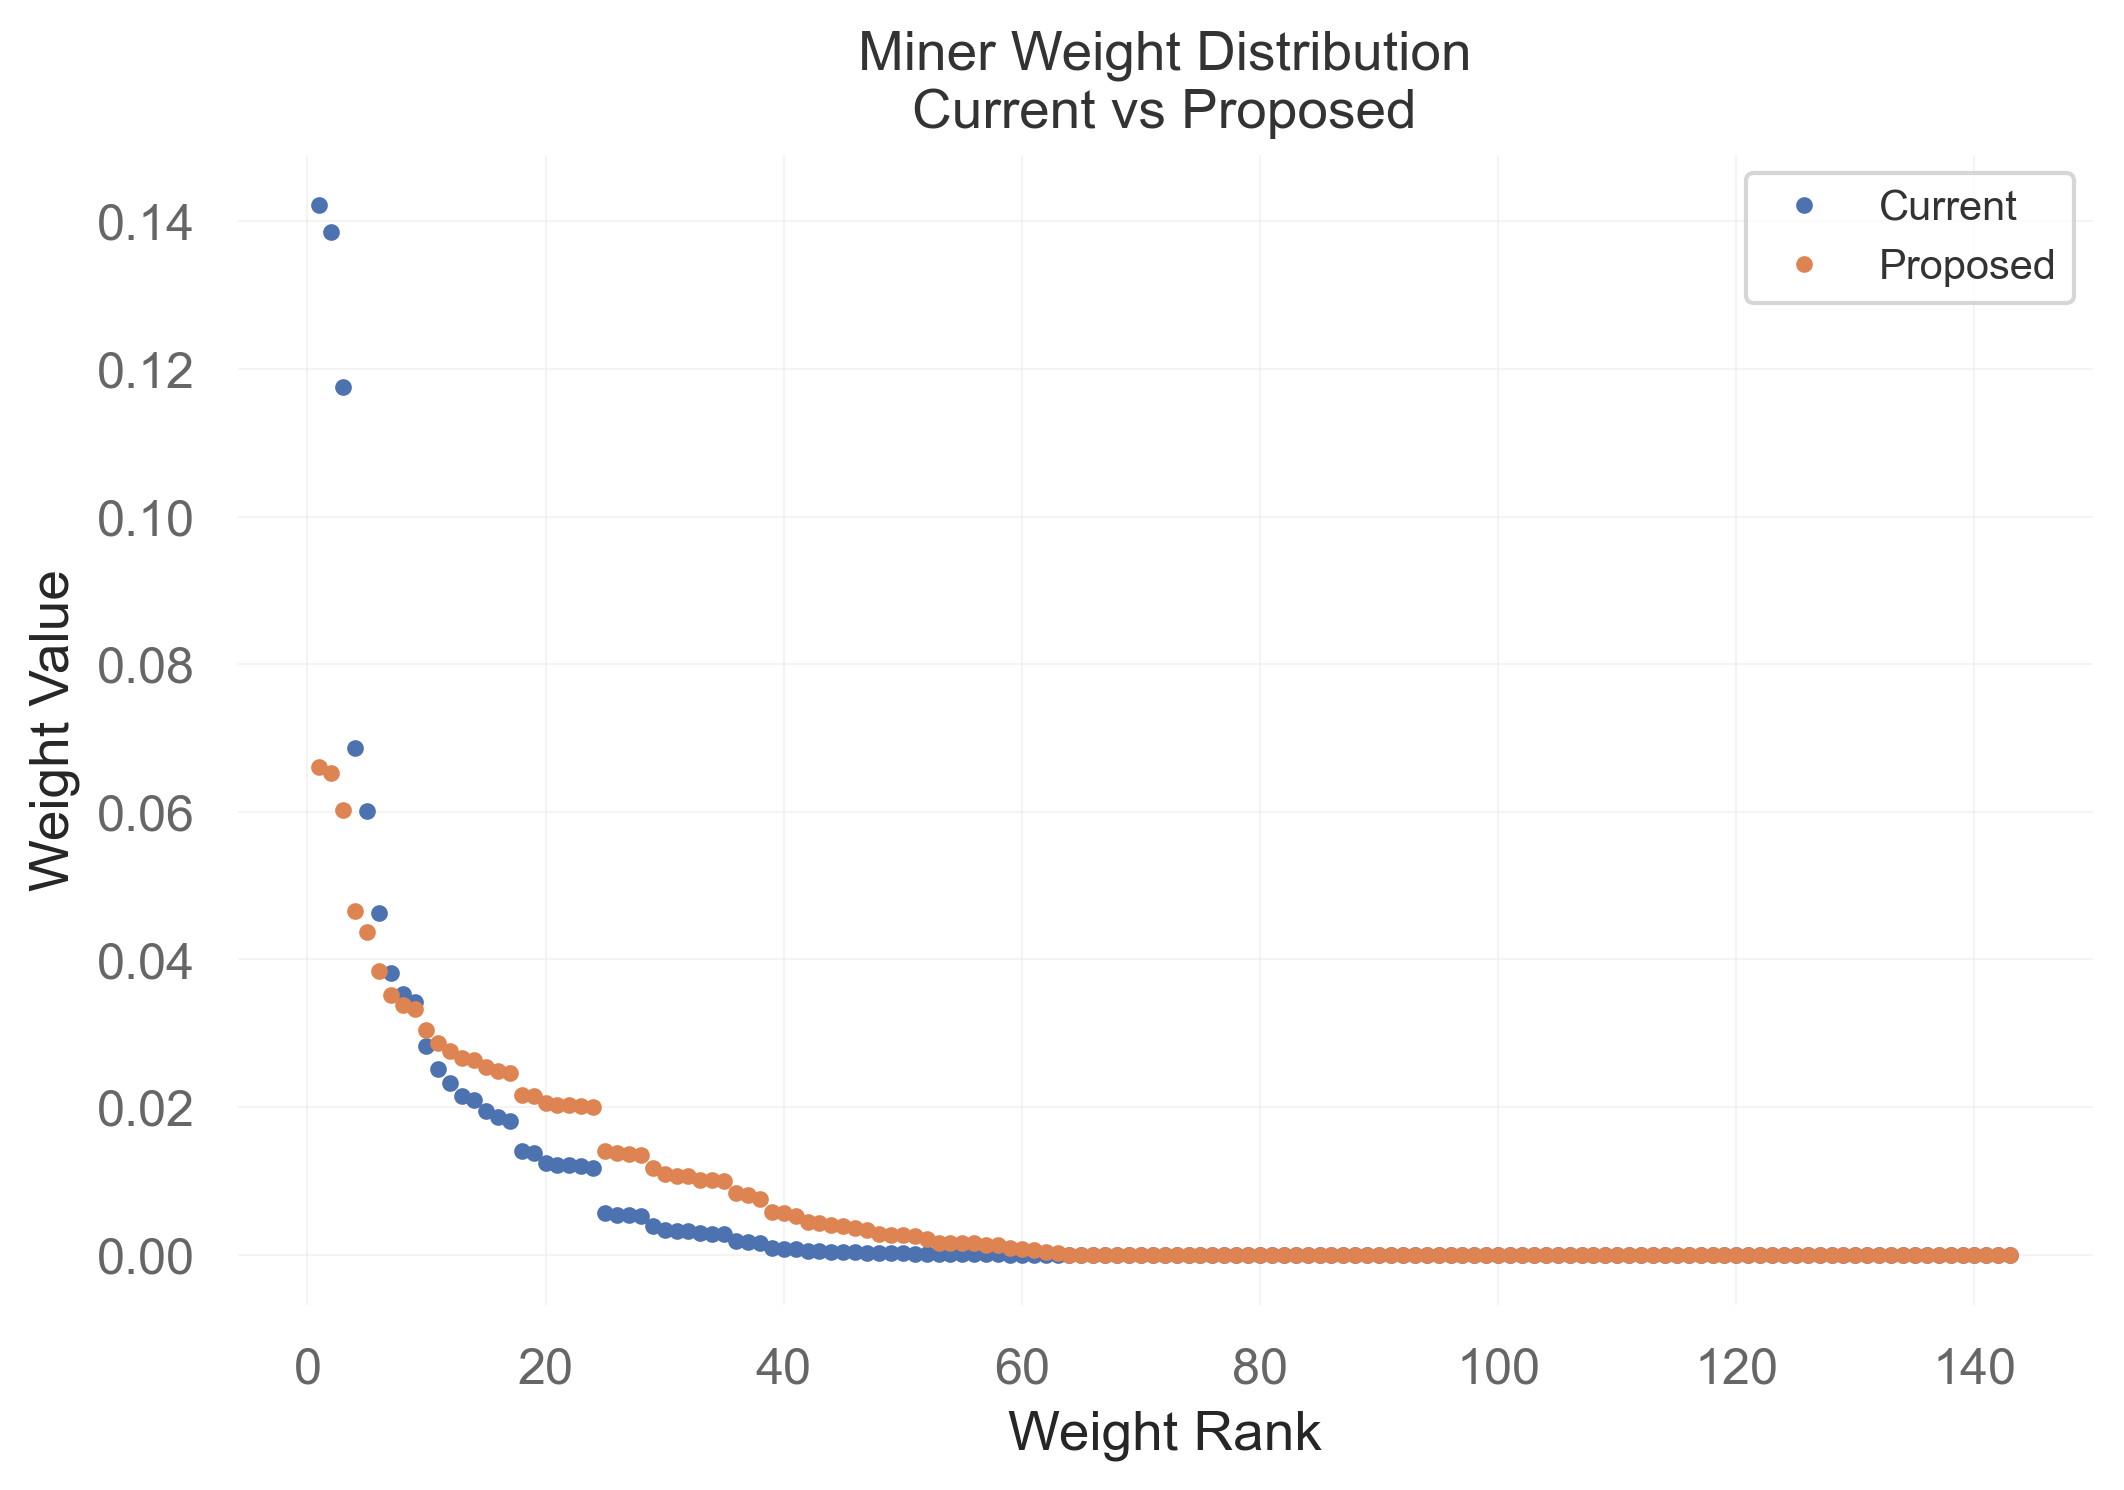
Softmax Temperature Adjustment
We will be increasing the temperature of our softmax from 0.06 to 0.125 to create a more balanced distribution of incentive to miners. This modification will:
- Reduce the extreme concentration of emissions among top performers
- Create a more gradual curve of incentive distribution
- Better reward incremental performance improvements across a broader range of miners
- Maintain strong incentives for excellence while improving accessibility
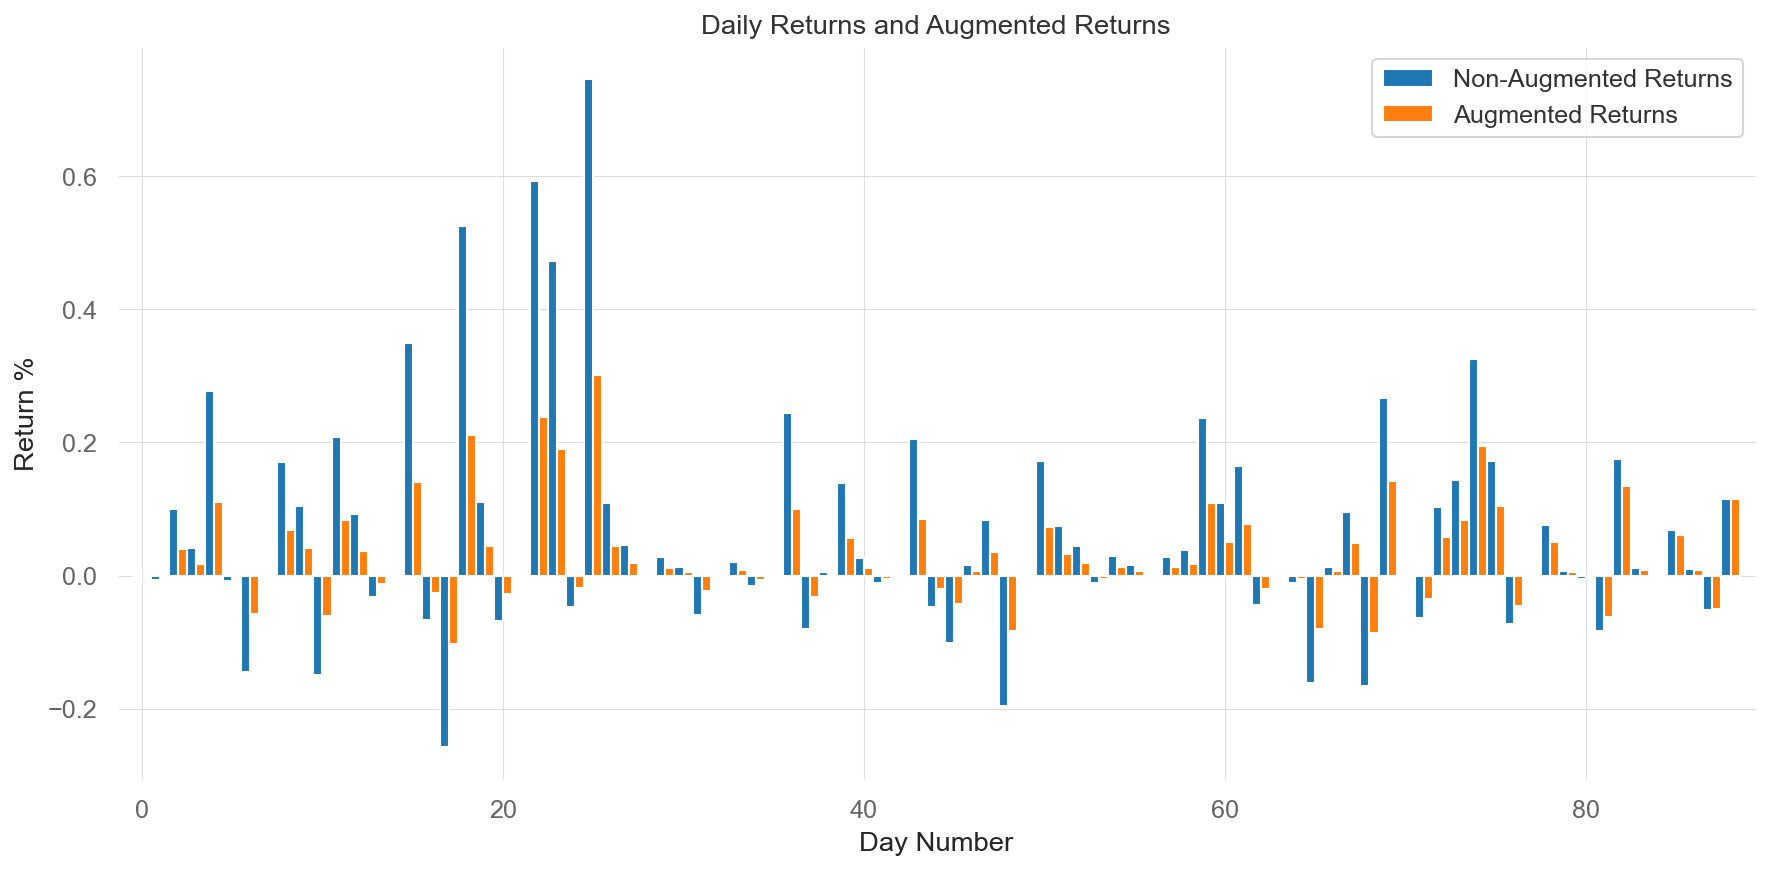
The following figure shows how this will likely impact the daily returns of miners for calculations:
Recency Weighting Simplification
We are simplifying our recency weighting mechanism by:
- Eliminating the short-term Calmar ratio
- Introducing a new scoring mechanic that directly augments daily returns
- Implementing an exponential decay function for historical returns
In practice, this will ensure that recent performance is weighted more heavily in the scoring process, while still accounting for historical performance. The following graph demonstrates how the new decay function affects the influence of historical returns. The X-axis shows days since PnL realization, while the Y-axis shows the remaining influence of those daily returns:
Note that the decay is capped, with a minimum value of 40% influence on the weighted average.
Additional System Improvements
- Maintain elimination criteria for risk management
- Simplified scoring process with reduced system complexity
- Enhanced emphasis on recent performance through return weighting
Academic Background
The proposed changes draw from several key academic works:
- Chen (2022)1 demonstrates the importance of properly weighted return metrics in portfolio management, particularly in the context of risk-adjusted returns (p. 78).
- Huynh et al. (2023)2 provide evidence for the effectiveness of time-weighted return metrics in capturing strategy decay and signal crowding (p. 54).
- López de Prado and Lewis (2021)3 explore optimal incentive structures in algorithmic trading systems, showing how proper temperature parameters in reward distributions can maximize strategy innovation while maintaining system stability.
Timeline
Proposal Delivery: Feb 21, 2025
PR: Feb 21, 2025
Integration: Feb 23, 2025
References
Footnotes
-
Chen, R. (2022). “Guide to Risk Management.” Fordham University. ↩
-
Huynh, T. D., Nguyen, T. P., & Pham, L. (2023). “Global Flow and Cross-border Investment.” Auckland Centre for Financial Research. ↩
-
López de Prado, M., & Lewis, M. (2021). “The Economics of Smart Alpha: Risk Sharing and Crowding in Investment Management.” SSRN Electronic Journal. ↩