Introducing Risk Profiling
This proposal outlines upcoming improvements to our risk assessment of miners’ trades.
Problem Statement
Our current system faces several challenges:
- The current risk assessment of miners’ trades and order placement behavior is not sufficiently comprehensive.
- The current Martingale penalty does not account for factors such as position size or leverage advancement—high-leverage martingale strategies pose significantly greater risks than low-leverage ones.
- The definition of martingale is relatively narrow. If a miner utilizes a specific order algorithm, such as TWAP or VWAP, it could be flagged under the current martingale detector and thus receiving penalties.
Proposed Changes
- Removal of the martingale penalty in favor of our updated risk profiling mechanism.
- Breakout of the penalty into a number of scoring categories within risk, which will help to bring more advanced analytics to our miners down the road.
- Repair of the daily returns calculation which was miscalculating the start date of each day as noon instead of midnight.
Flagging Risky Positions
To avoid the steepest impact of this risk profiling penalty, use the following rules as a reference. If all three conditions below are met, the position will be flagged as risky and penalized:
- Stepping three or more times into a position or increasing the max leverage twice on a losing position.
- Using more than 50% of the available leverage on the trade pair or increasing leverage by 150% relative to the entry leverage of the position
- Having uneven time intervals between orders, which would indicate they are not TWAP-scheduled orders.
TWAP Simulation and Detector
To accurately identify martingale strategies without unfairly penalizing TWAP orders, we developed a TWAP detector. The effectiveness of the detector is evaluated based on an extremely low false positive rate of less than 0.01%—meaning that if an order sequence follows a single TWAP pattern, the probability of the detector incorrectly classifying it as non-TWAP is below 0.01%. We also allow for some error in the TWAP order execution timing.
To compare TWAP orders across different time scales, we compute a normalized error of a position’s order time intervals using only the orders up to (and including) the one that brings the position’s leverage to its maximum level.
We calculate the ideal interval between TWAP orders. The normalized error is then computed by comparing the actual intervals to the ideal, normalized by the ideal interval.
We found that the normalized errors of TWAP order time intervals do not depend on the order time interval or the total order time, but depend on the number of TWAP orders in a position. Below are two example plots.
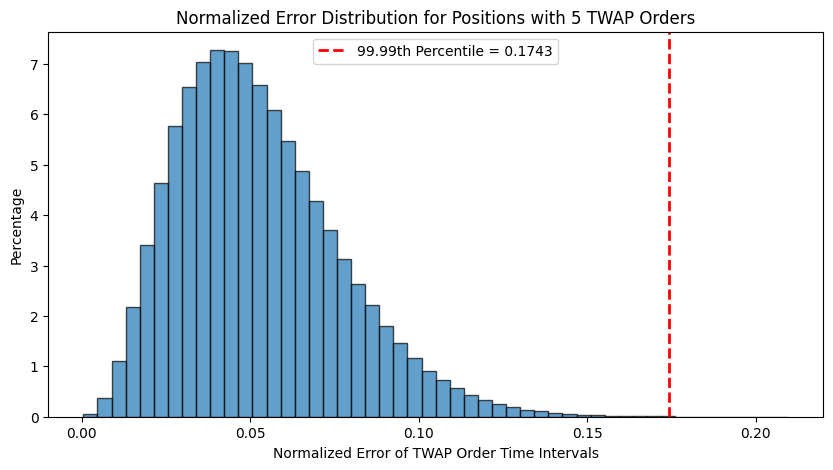
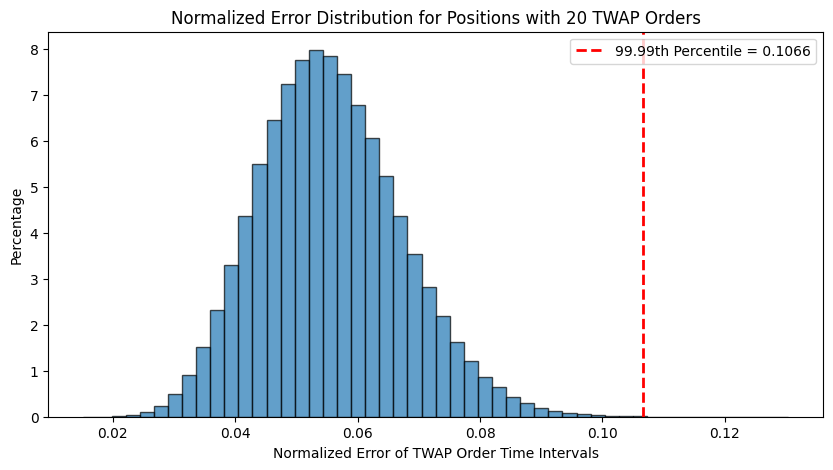
We examined how the 99.99th percentile (0.01% false positive rate) of normalized errors changes as the number of TWAP orders per position varies from 3 to 100. For each order count, we simulate 1,000 positions. The average 99.99th percentile decreases and eventually stabilizes as the number of orders increases.
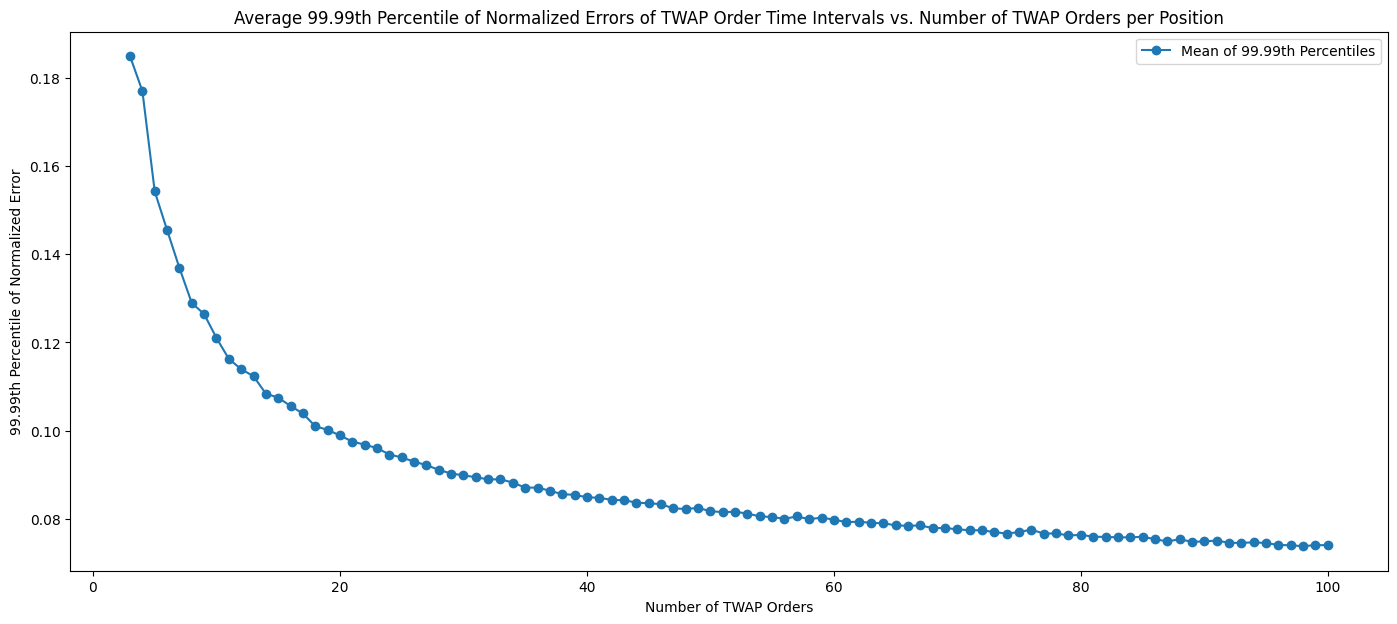
In order to be conservative when detecting TWAPs with varying numbers of orders per position, we have decided to set the normalized error threshold at 0.185. If the normalized error of a position’s order time intervals exceeds 0.185, we will consider that position not to be executing a TWAP strategy.
Integrating Time Utilization into Risk Profiling
A position’s time utilization is defined as the normalized error of order time intervals mentioned above. A position is flagged if its time utilization exceeds the threshold of 0.185. By integrating this time component with other criteria, we can calculate a miner’s risk profile score and corresponding penalties.
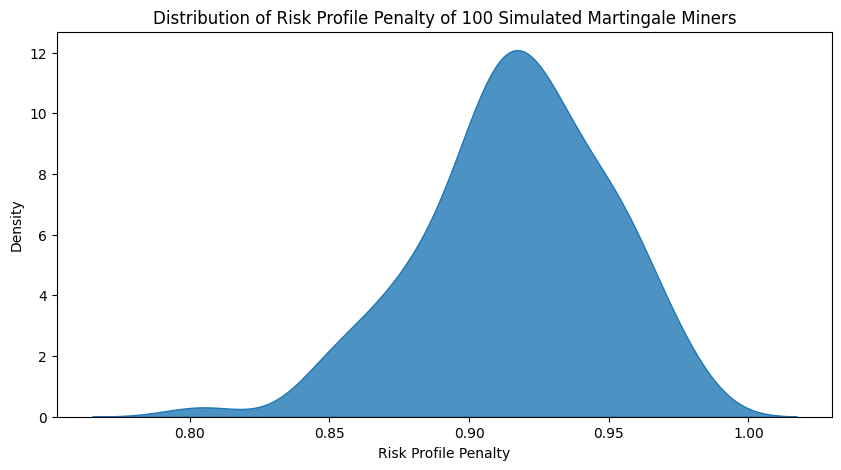
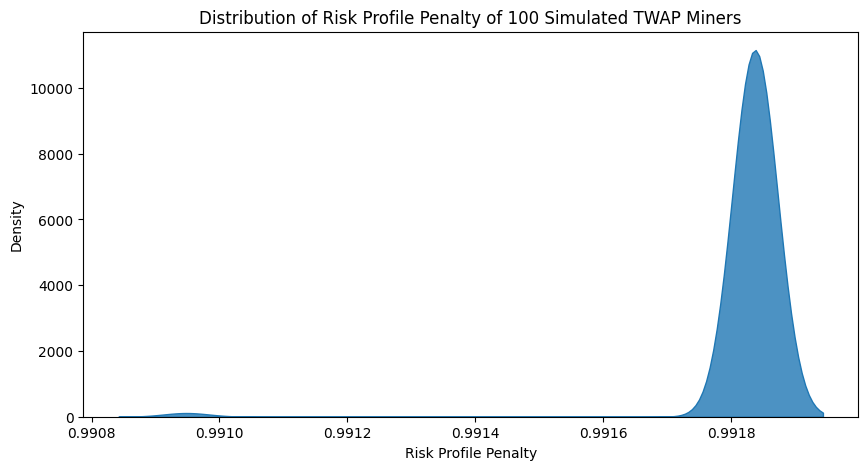
We simulated 100 miners trading JPY/USD using martingale strategies and TWAP algorithms in the past year. The distributions of their risk profile penalty values are shown below. Penalty values range from 0 to 1. A lower penalty value indicates a higher penalty. The results show that TWAP miners receive minimal penalties, whereas martingale miners incur significantly higher penalties.
The following graph illustrates the relationship between risk profile penalties and average time utilization for simulated martingale and TWAP miners, as well as current Vanta Network miners.
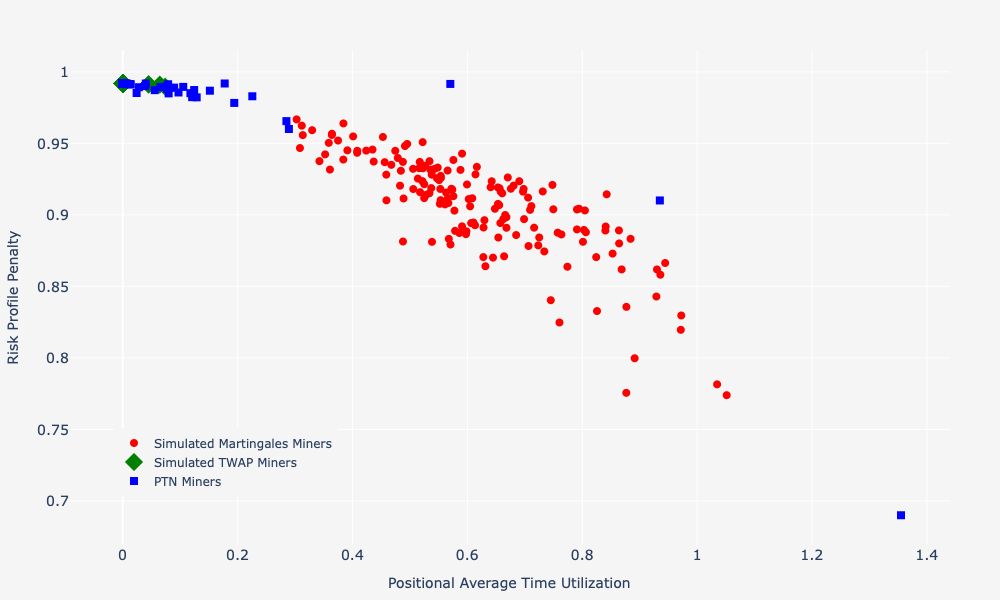
The risk profiling penalty effectively differentiates TWAP from martingale strategies. Future enhancements will include support for VWAP and varied TWAP order schedules within the same position.
Timeline
Proposal Delivery: Mar 4, 2025
PR: Mar 5, 2025
Integration: Mar 7, 2025