Long Term Focus, Shift in Augmentation
The objective of Subnet 8 is to curate high-quality trading signals capable of being sustainably used by a network model. We use a blend of different metrics to evaluate the long-term quality of a miner, which allows us to automatically identify talent and incorporate it into a trading strategy. There are three primary risk-adjusted metrics used to evaluate quality. Our miners are ranked against each other for each of these metrics, and their percentile for each category is computed. To illustrate this, we introduce a hypothetical miner who is in the 90th percentile in short-term returns, 70th percentile in long-term returns, and 80th percentile in Omega.
- Short-term Return (95%)
- Long-term Return (50%)
- Omega (15%)
Our miner starts with a perfect score of 1. Their ranking in short-term returns (0.9) will multiply their original score by (0.95 * 0.9) + (1 - 0.95) = 0.905. The objective with this structure is to encourage strong performance in all categories, while recognizing that different metrics should have varying degrees of weight in the system. Our miner’s final score with current weighting:
- Short Term: (0.95 * 0.9) + (1 - 0.95) = 0.905
- Long Term: (0.5 * 0.7) + (1 - 0.5) = 0.850
- Omega: (0.15 * 0.8) + (1 - 0.15) = 0.970
Total Score = 1 * 0.905 * 0.850 * 0.970 = 0.75
Problem Statement
The current incentive system has done well to incentivize miners to capture short-term gains. However, from the perspective of a network model, this is not ideal for a couple of reasons:
- When the miner captures incentives on SN8, it is typically after they close a winning position. While this assumes they are more likely to make another winning trade after closing one, we are at times rewarding miners for short-term gains without a demonstrated strategy for sustained performance.
- Emphasis on short-term returns with a narrow window introduces high volatility, as they will likely track both gains and losses through the course of a position depending on their strategy.
- We want to consider a larger breadth of scope from the miner’s trading history, but we currently ignore a portion of the miner’s prior trading activity through historical decay. Additionally, the various decay factors lead to confusion for new miners.
- With recent updates to the fees and positional leverage, we want to better align incentive penalties with other risk-adjusted metrics.
Proposed Changes
We propose changes to two primary systems: scoring weights and consistency. Additionally, this proposal will make a couple of small tweaks to simplify existing systems.
Scoring Weights and Augmentation
Miners with a demonstrated capacity for capturing historical sustained returns will be prioritized in the incentive system by increasing their relative weight in the scoring mechanism to 1.0 from 0.5. This will make the final output of the system closely tied to miners with strong long-term performance, potentially dropping your score to 0 if you are last place in long term scoring. This will pair nicely with our future objectives of increasing our review window from 30 days to 90 days. We will also reduce the significance of short-term returns from 0.95 to 0.25. This means that a miner with top long-term returns will likely stay in the top 25%, even with poor short-term performance. Sustained poor performances by the miner will of course impact their long-term returns, ultimately dropping their ranking. As Omega is not the focus of our analysis, we will also be dropping its significance from 0.15 to 0.05—a bonus on efficient investment.
To summarize, the weights will change as follows:
| Criterion | Old Weight | New Weight |
|---|---|---|
| Long Term Returns | 0.5 | 1.00 |
| Short Term Returns | 0.95 | 0.25 |
| Omega | 0.15 | 0.05 |
In addition to changing the weights, we propose a modification to the current historical augmentation. This is meant to maintain much of the same functionality, but in a simpler way. The following graphic outlines the prior decay rates used to augment returns for long and short-term scoring:
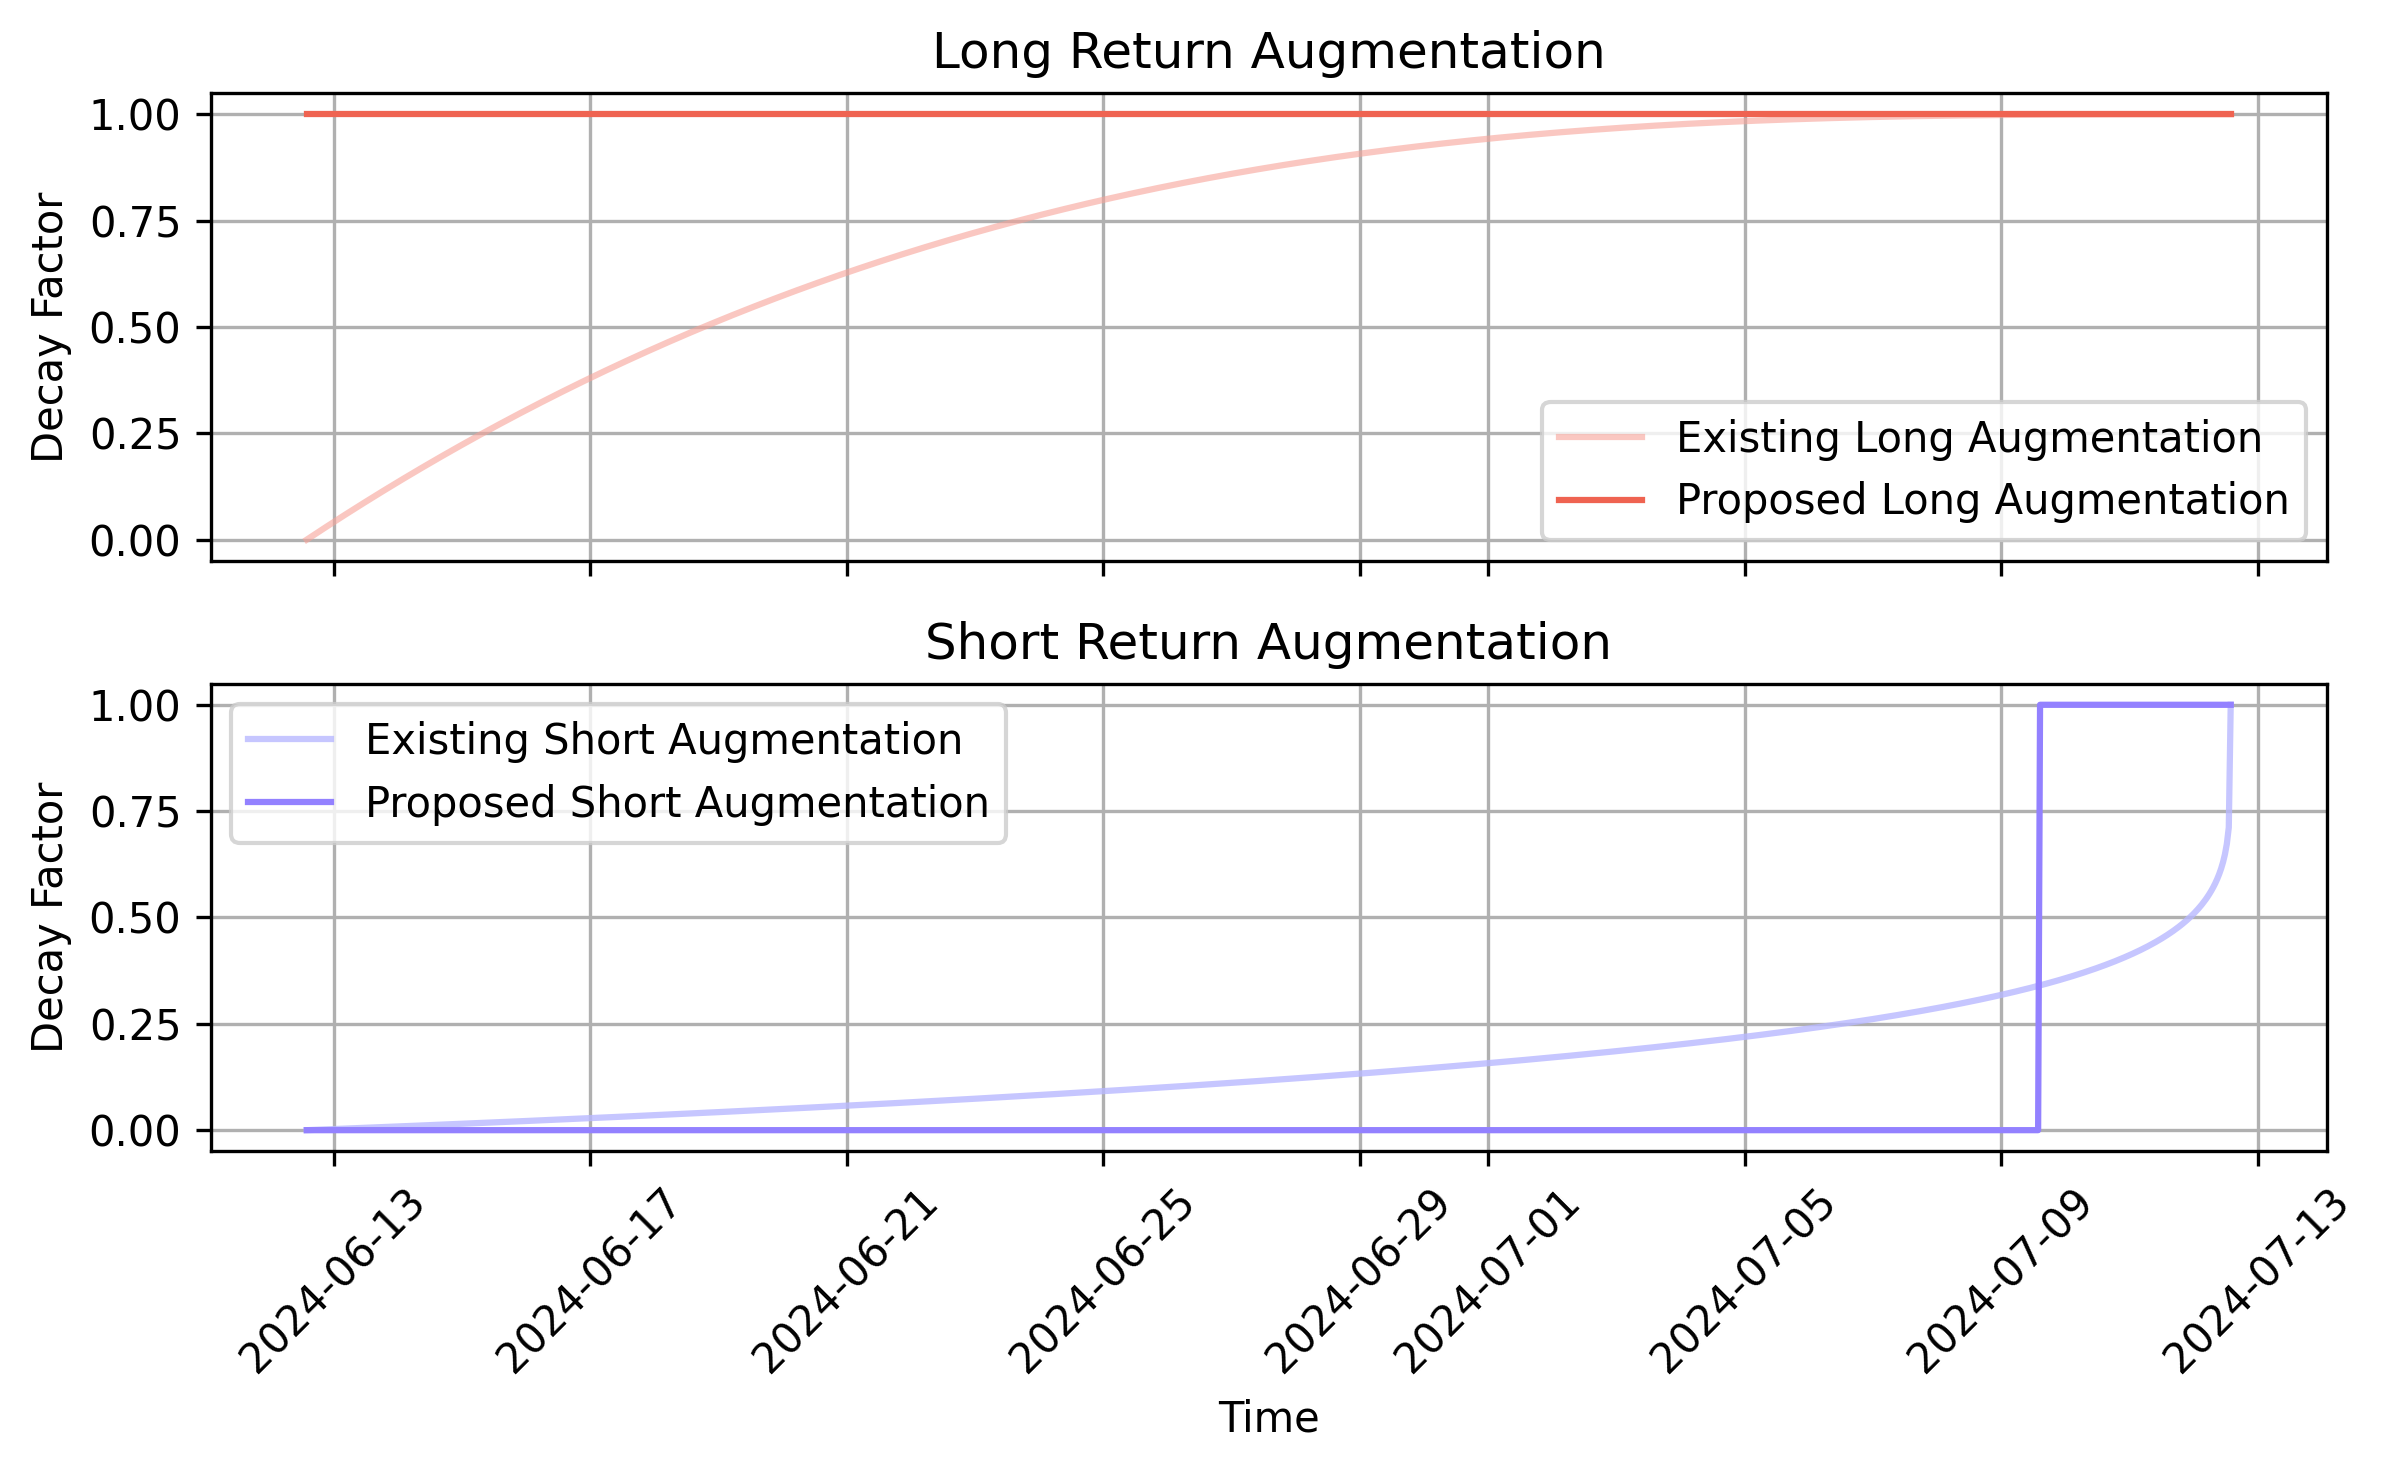
There would be no long-term decay. Instead, we would look at the entire past 30 days of activity to determine the long-term returns from the miner. We are also proposing to drop augmentation on short-term returns, opting instead to use a cutoff after three days. This not only simplifies the logic and improves the responsiveness of the incentive mechanism by reducing the number of sigmoids required but also avoids the scenario where strong prior returns still leak into the short-term score, even with deep augmentation. The following graphic shows how the cumulative returns for one of our miners (5FmqXG5YBU1Hke9jHD5FT41CUM9gVod7nFgYvbd7PmpqcUJm) would change, with the new logic capturing much of the same prior behavior:
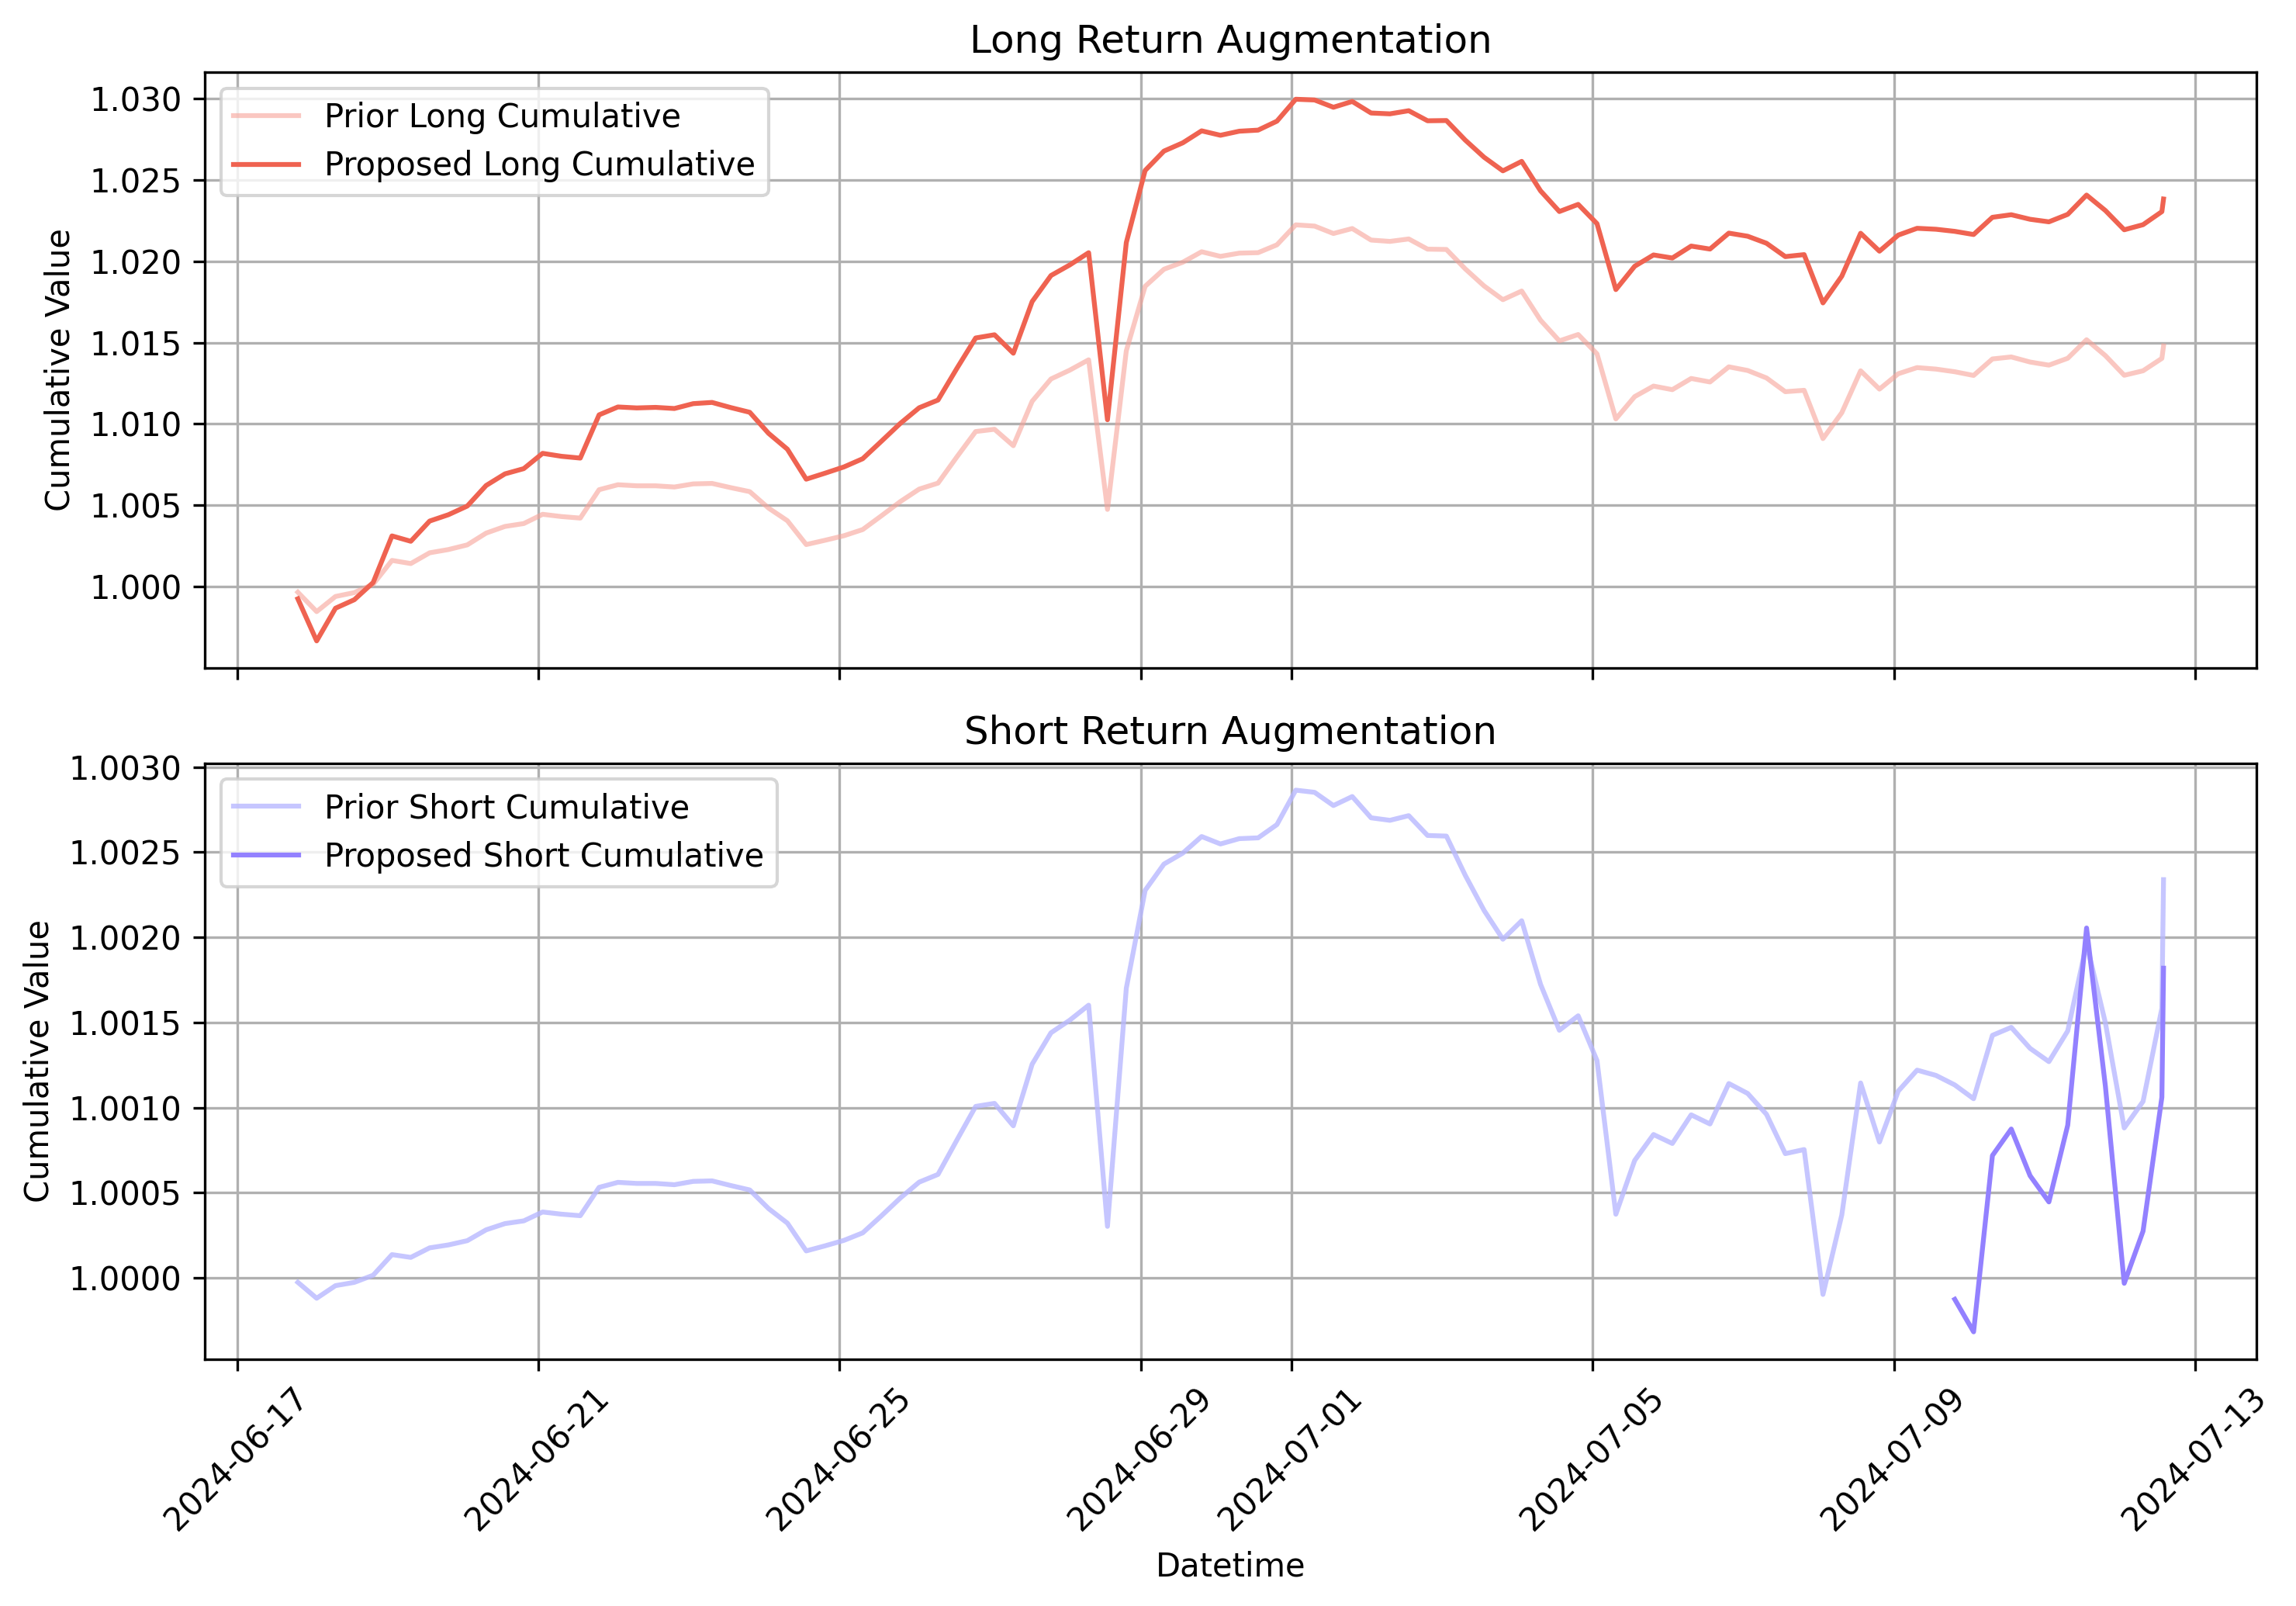
Our prior short-term returns mostly passed through returns from within the most recent 16-hour window. This period is too small, such that the short-term returns may exhibit a higher level of volatility as the miner’s portfolio value changes in response to dips and peaks within a single position. To mitigate volatility in portfolio value changes through the duration of a position, we looked at the more profitable trades on the platform per unit of time that the position was open. The following graphic depicts this information, where the x-axis is the number of days the position remained open in log format, while the y-axis is the return of the position per unit of time:
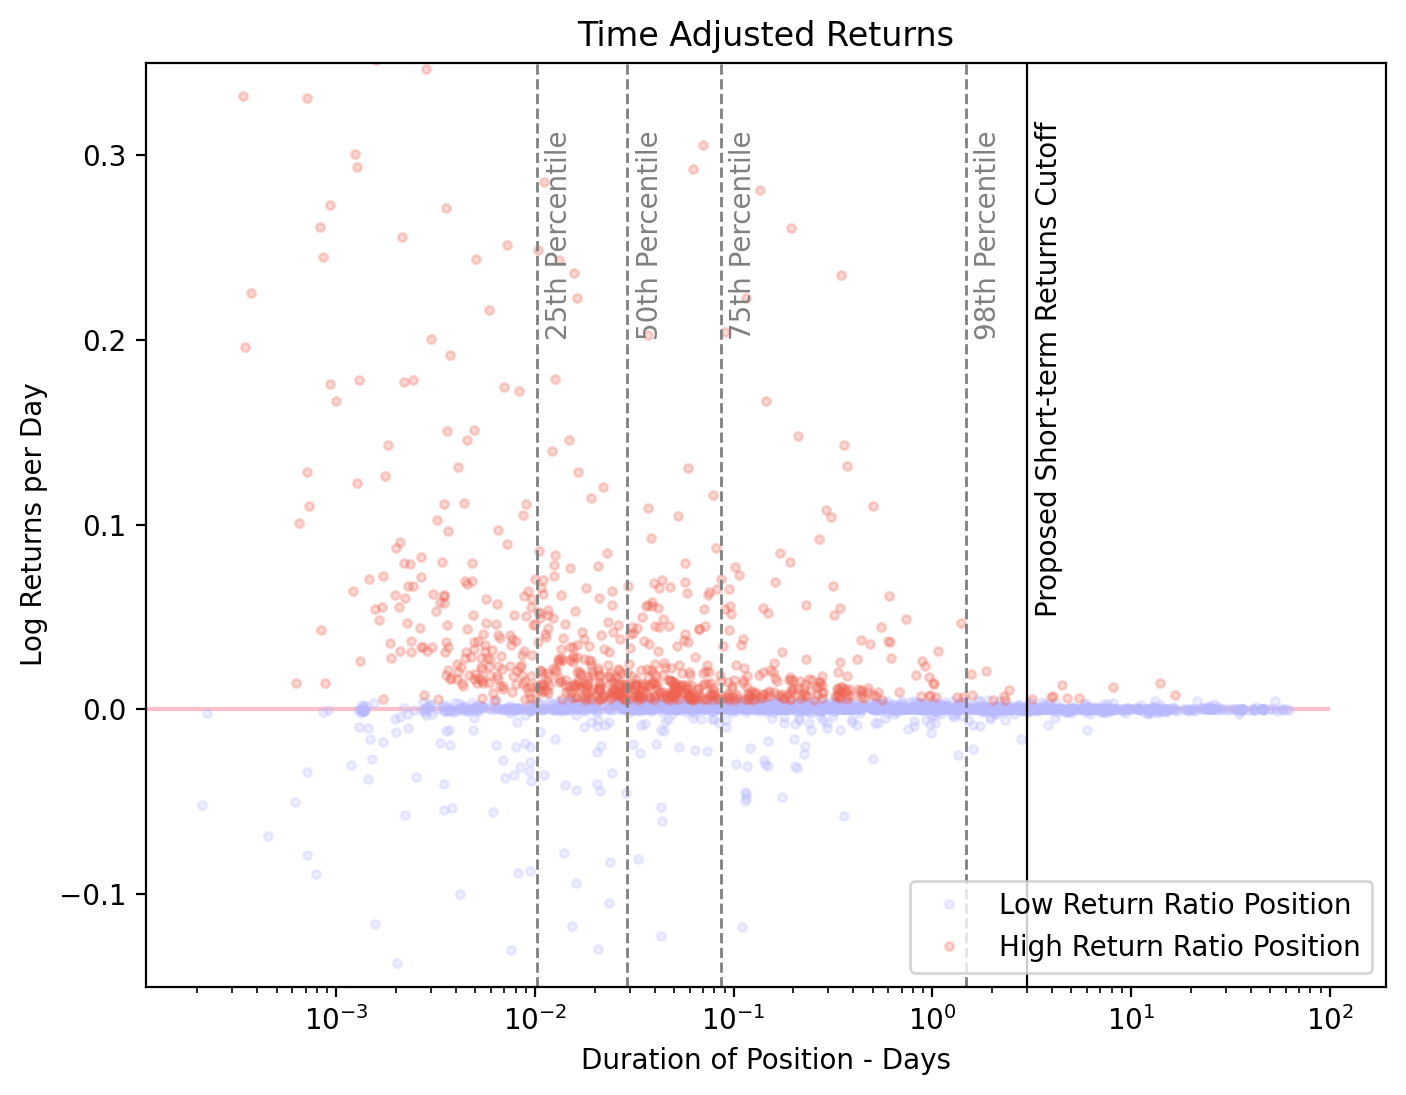
Among the positions with a high return per unit of time, almost all of them were within 36 hours. To mitigate most of the volatility, we would like the short-term window to be at least twice this size, such that the average value for the short-term should be more reasonably representative of the miner’s strategy at any moment. As such, 72 hours, or three days, was selected as the short-term returns cutoff for now.
Consistency
Currently, consistency on Vanta Network is defined as having transaction volumes in line with historical transaction volumes. Consistency is currently measured by looking for abnormalities in trade volume, measured using our checkpoints system. Checkpoints compress the changes to miner portfolio value over 6-hour periods, allowing us to determine with second-level precision how the miner performed. The following graphic visualizes the current process:
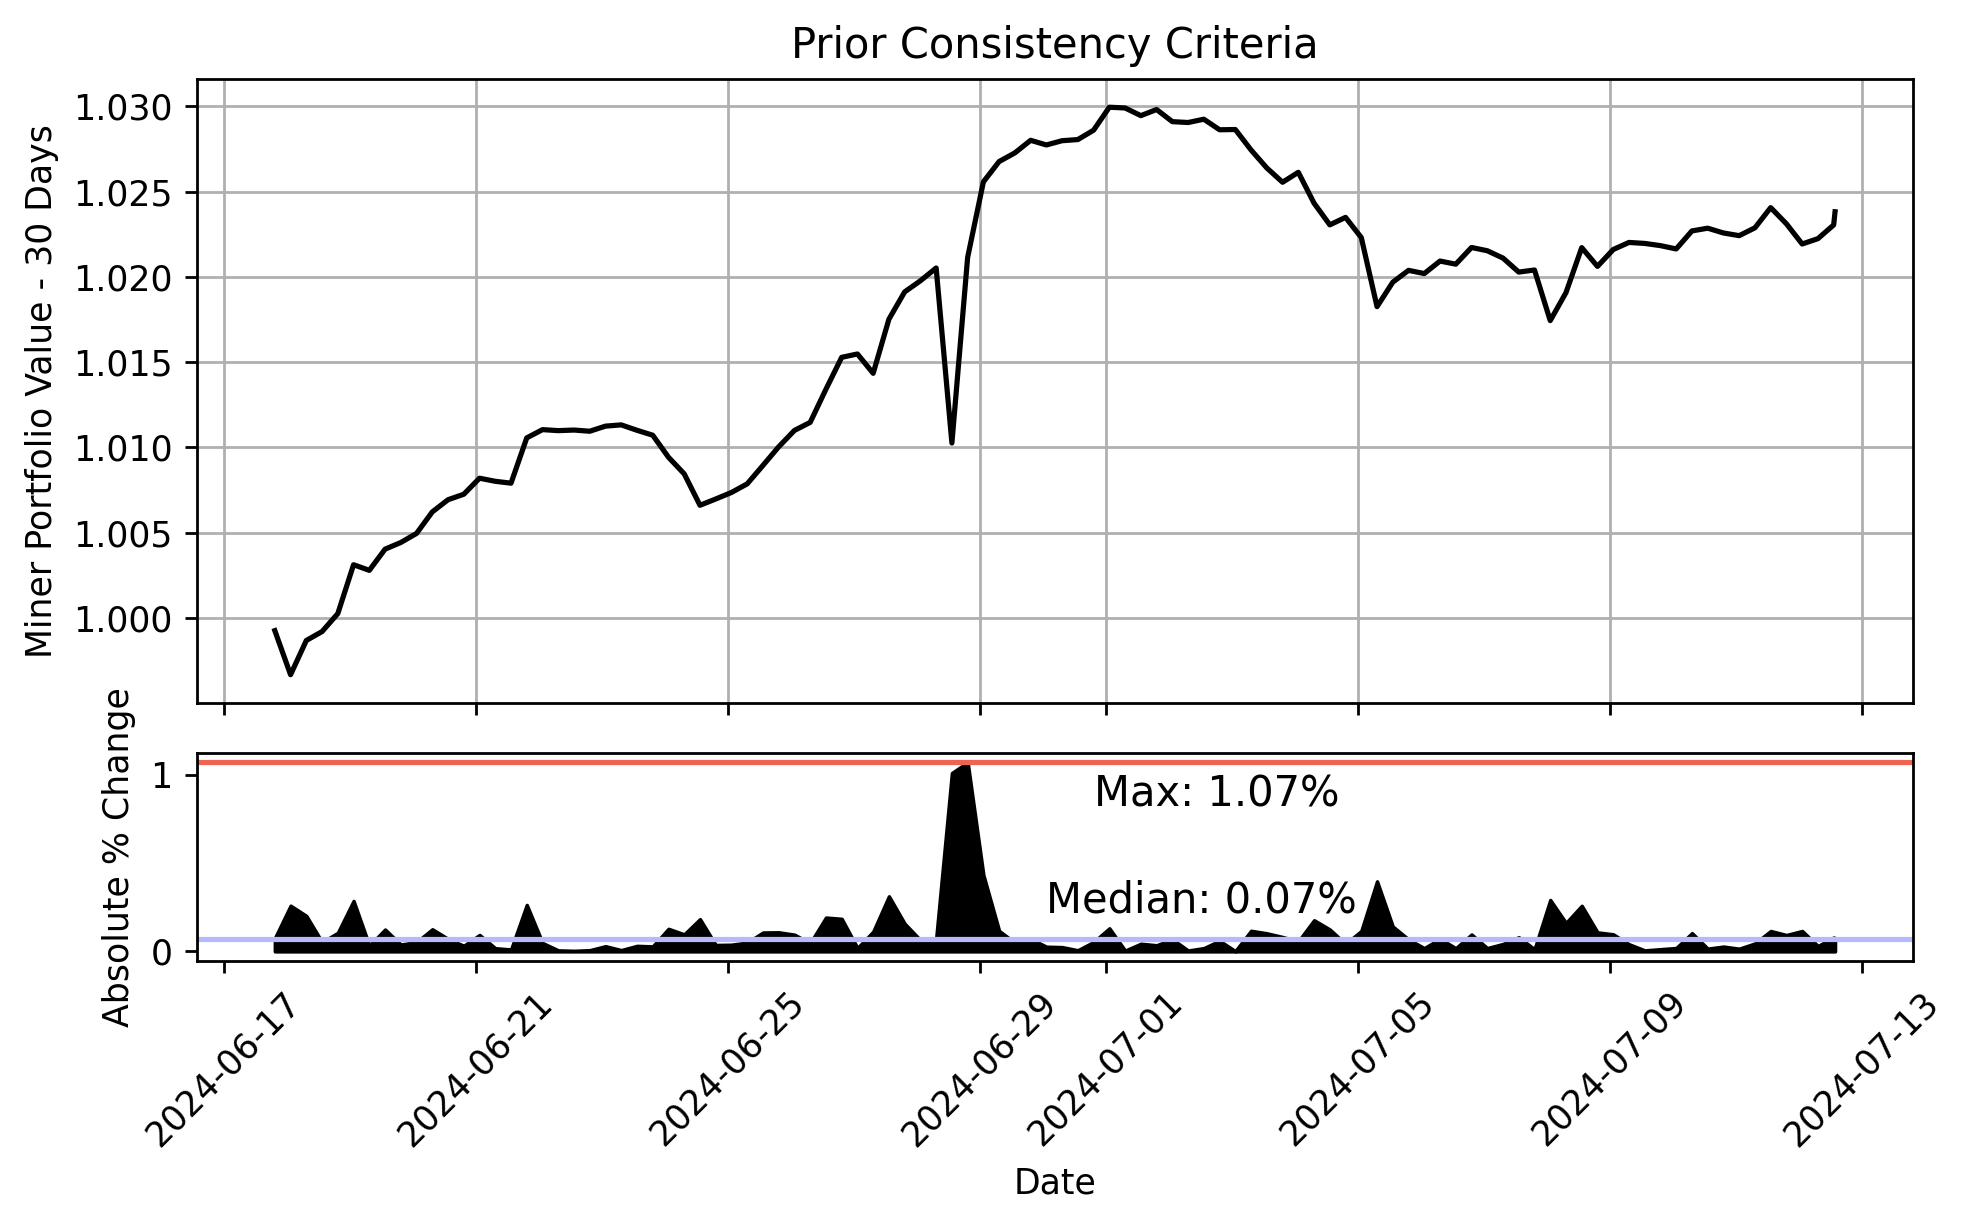
We look at the ratio between the largest value change seen in the portfolio and compare this to the median value of portfolio change. In doing so, we neglect macroscopic portfolio movements and allow some miners to oversee large swings in portfolio value over many weeks but still score well in consistency. Additionally, the current structure is challenging to communicate and lacks intuitive connection to trading behavior.
We propose to change the definition slightly by considering the current final portfolio value instead of the median value:
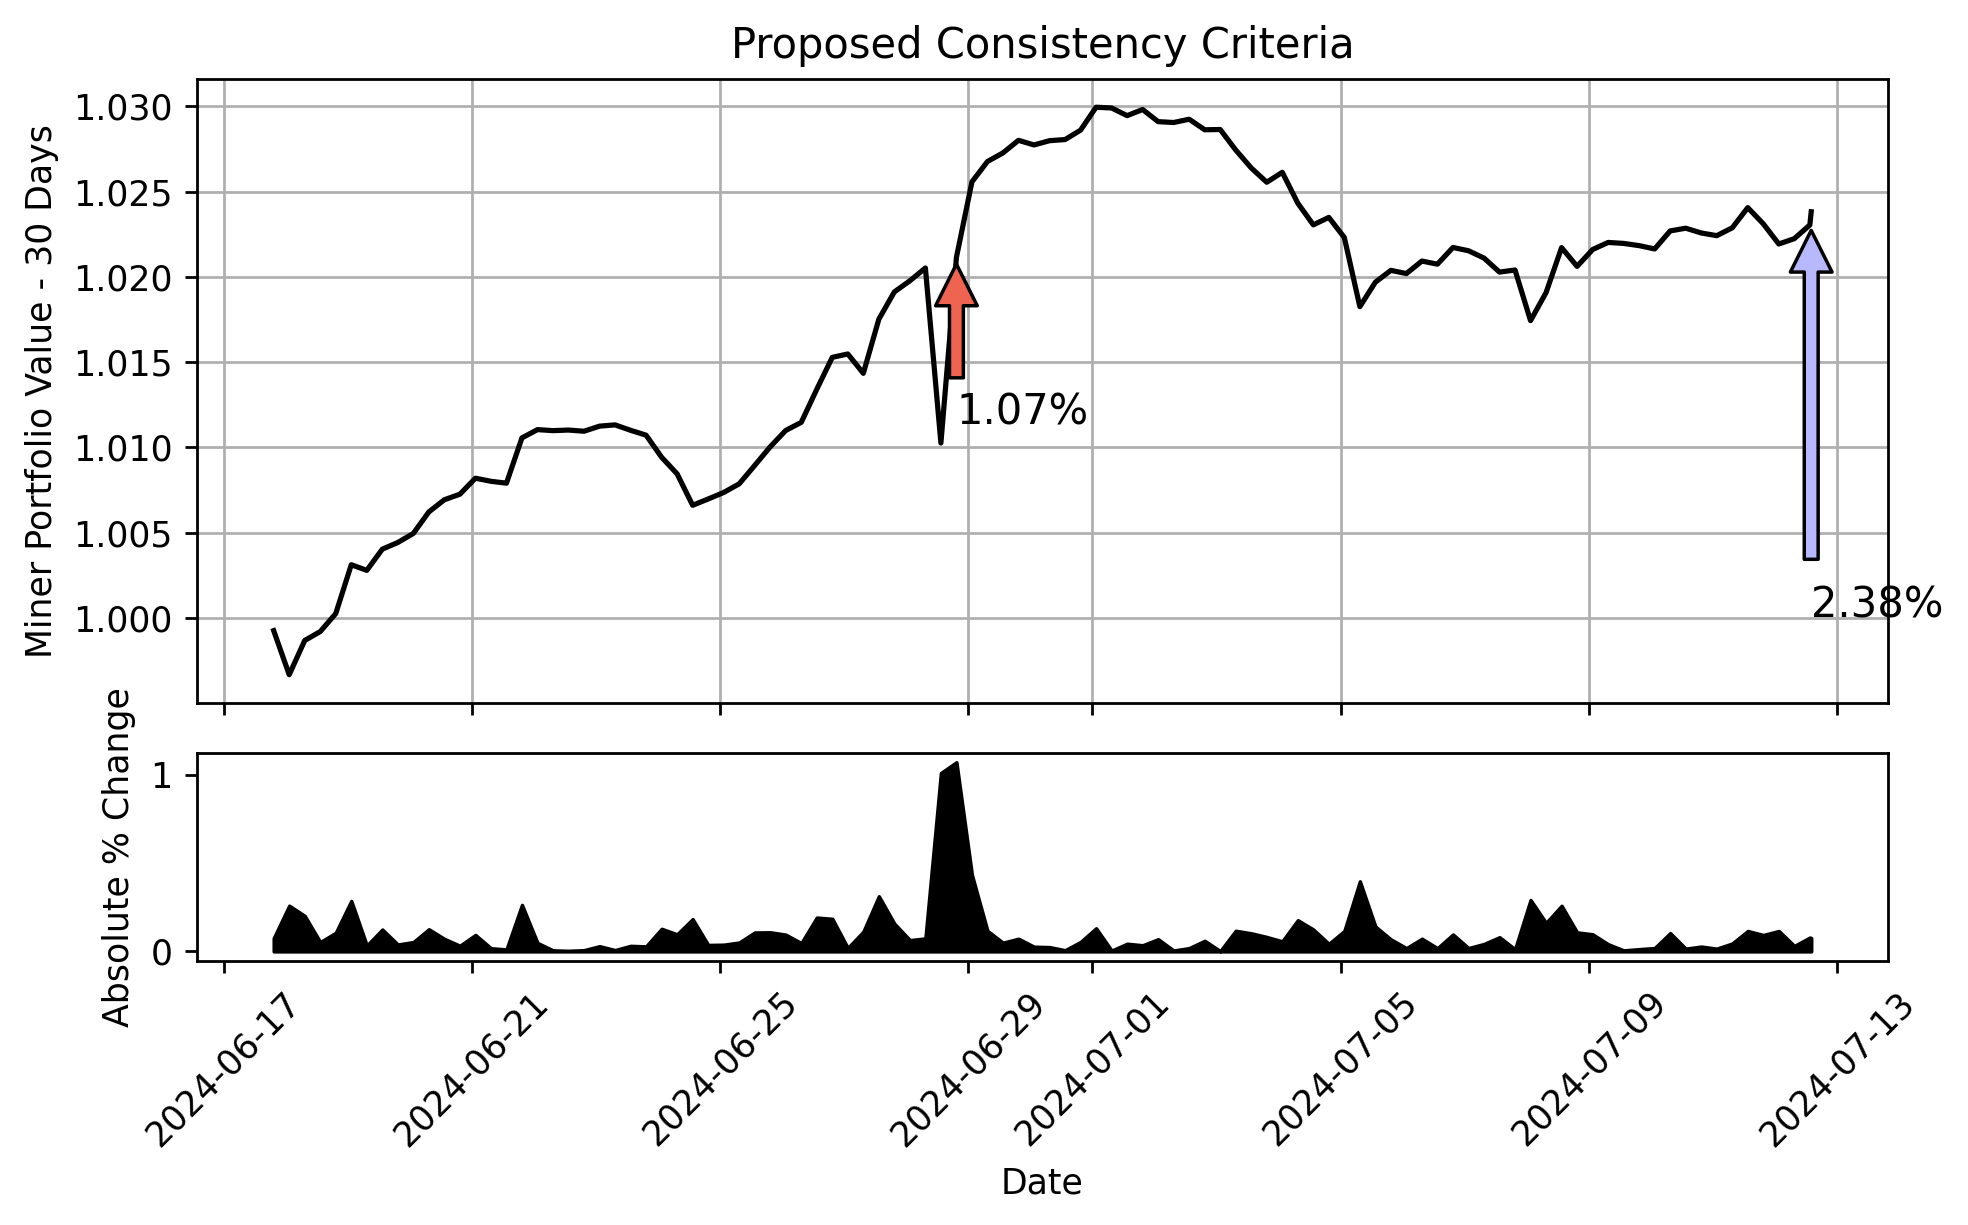
In our prior formulation, the miner would be judged against their ratio of max value to median value: 1.07 / 0.07 = 15x. In the new formulation, the miner would be judged against their current cumulative 30-day return relative to the largest delta overseen in one period: 1.07 / 2.38 = 45%. This better maps to intuition, as up to 45% of the total value may have come from a single period of the transaction.
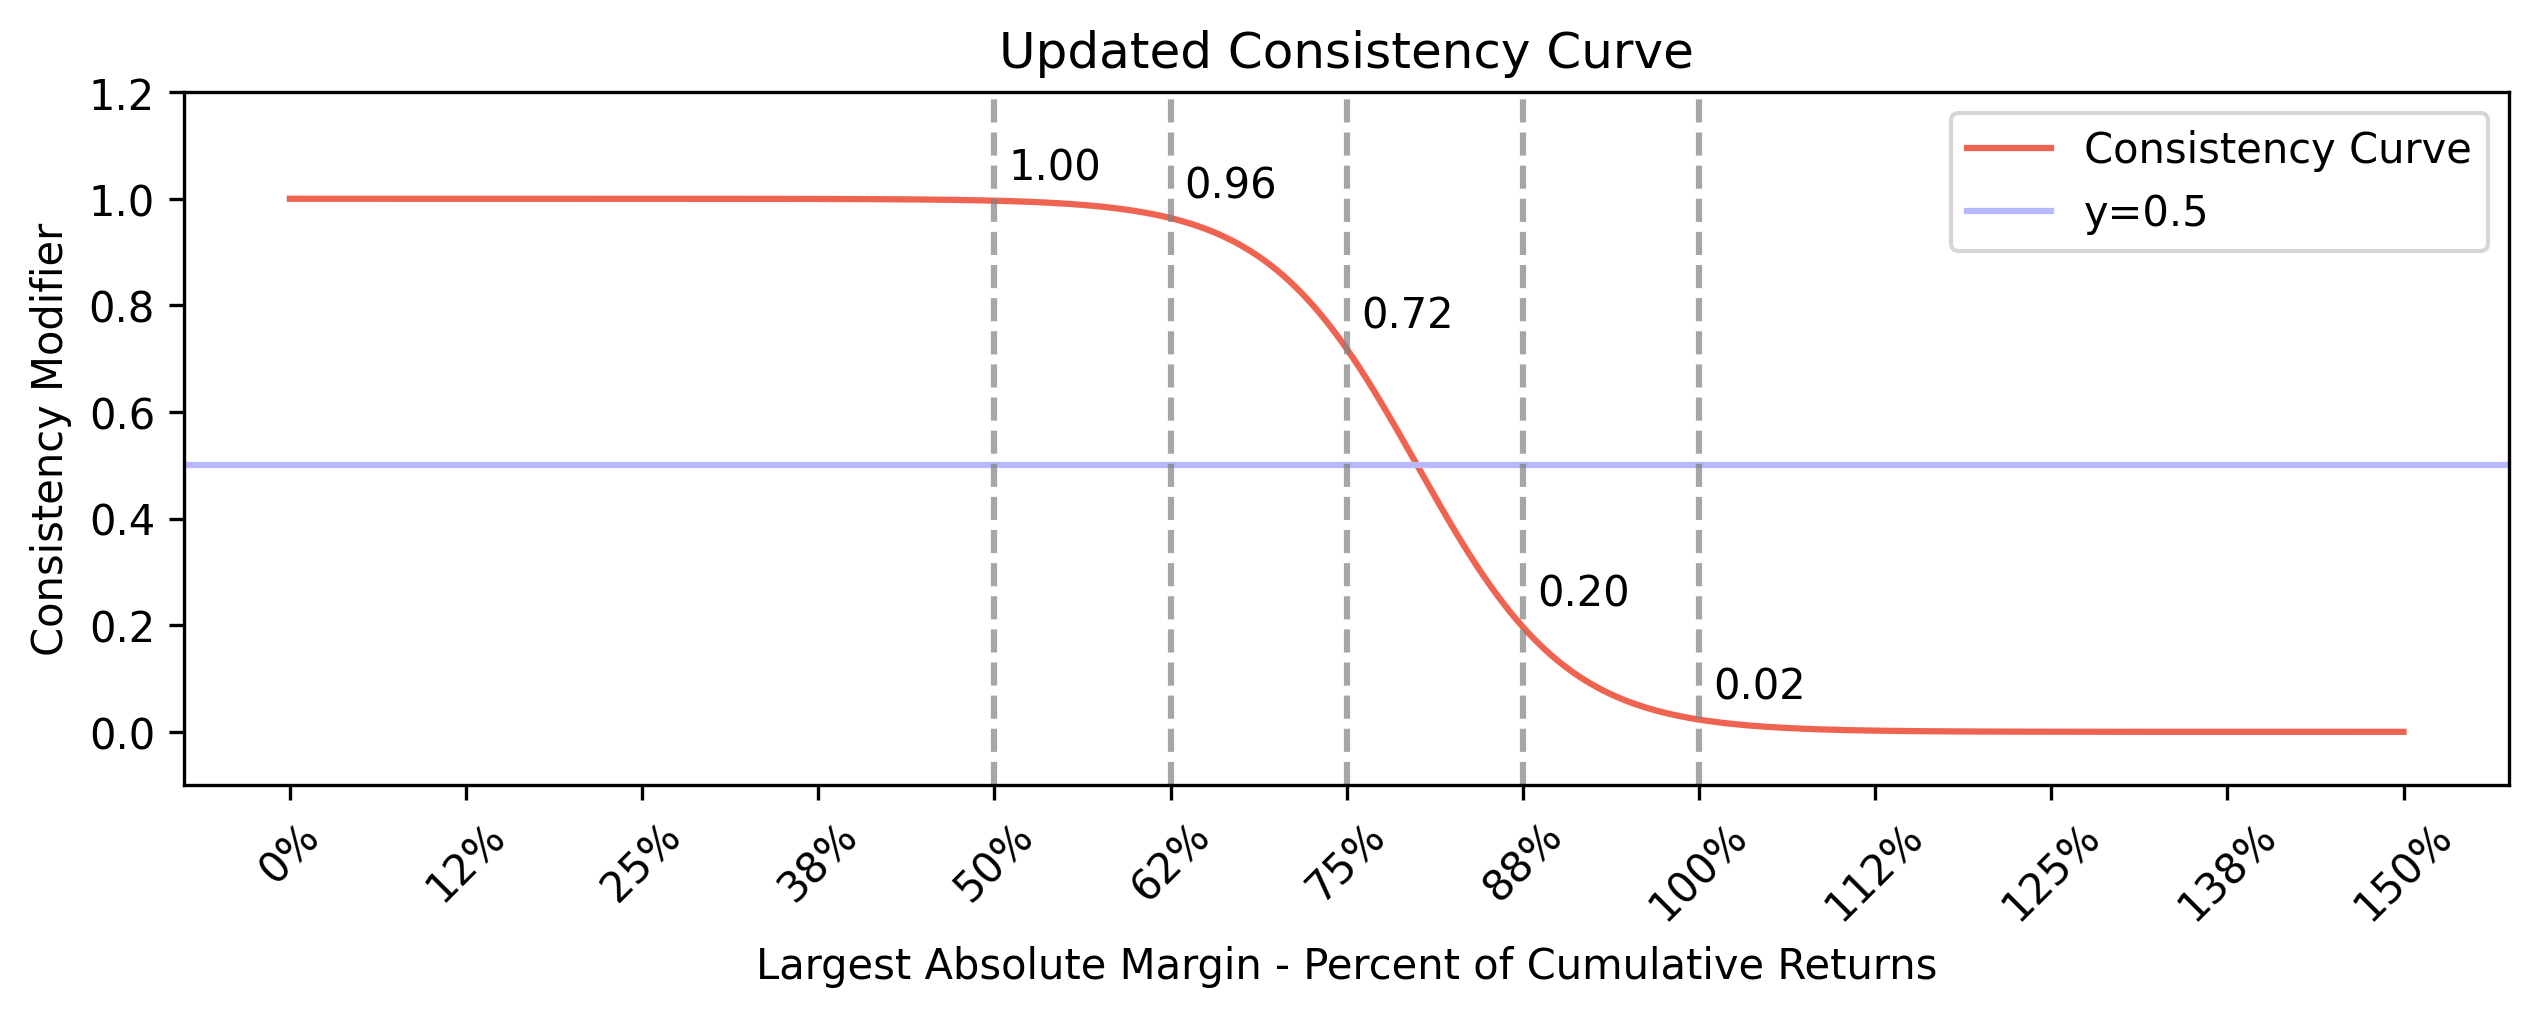
In this new formulation, as a miner’s portfolio value swings back towards 1.0 from a prior high, it is possible that their ratio is larger than 1.0. This would now score poorly in consistency and allow us to track macroscopic portfolio value trends. The following image shows the updated sigmoid curve relative to this new ratio:
Scoring Penalty Tweak
There was a slight issue where miners with full drawdown penalty would score 0 for each category, but still be included in the percentile distribution. Given how many miners were in high drawdown, the percentile of these miner scores was often above zero, and these miners would capture some level of incentive. To solve this, we will now only run the percentile distribution on miners without full penalties, and miners with drawdown above 5 will always explicitly be set to 0.
Additional Information
As this change will not impose any new fees or trading behavior on the miners, we will apply this new scoring to your trading behavior over the prior month of activity. We will monitor changes in behavior to the new consistency penalty and propose adjustments as needed, particularly with any changes to the 30-day lookback window.
Timeline
Proposal Delivery: July 15, 2024
PR: July 15, 2024
Implementation: July 17, 2024