Returns Penalty - Realizing the Unrealized
Vanta Network is meant to generate high quality trading signals. To accomplish this, we task miners with designing and implementing a high quality trading strategy. We use a system of unrealized returns to track miner performance, which looks at their portfolio value change over a thirty day period to determine their ranking among other miners. With the current structure, miners can continue tracking positive portfolio value increase without closing positions, increasing their score in the system. The intention with this design is to allow customers of Vanta Network to attach themselves to top miner signals at any time, copying the same leverage from the miner. The ideal top scoring miner will modulate their leverage / position direction dynamically with the market to capture the most return.
Problem Statement
While this structure does well to encourage and rank miners based on their risk adjusted returns, there are a couple of challenges to translate their trades into a network model and communicate the value of each miner to institutional investors who may be interested in using the product.
As some miners never close positions, describing the behavior of miners with traditional position based metrics like Sharpe, Sortino, and Omega is impractical. Yet these closed position metrics are critical to determine the quality of the traders for institutional investors.
Proposed Changes
There are two primary changes proposed with this update: Positional penalties and a new scoring distribution.
Positional Penalties
To address the first point, we will integrate a new penalty which will extract information from positions which were opened and closed within the checkpoints lookback window. We will use the returns from closed positions to determine two ratios which will be used to design the posittional penalty:
- The ratio between realized and unrealized return.
- The ratio between the largest return from a closed position and the total return from all closed positions.
Realized / Unrealized Ratio
The intention with this ratio is to encourage miners to have some degree of alignment between realized and unrealized returns. As we will only use positions which were opened and closed within the lookback window, there will be more perfect alignment between these two returns if a miner is to take shorter and more frequent positions. These additional touch points should give us more opportunities to examine the quality of their strategy using traditional metrics, providing value by giving us more confidence in their capacity. We will use the following formula to determine the ratio between realized and unrealized returns:
This will look at the spread between the realized and unrealized returns, and normalize it by the unrealized return. This means that miners with a larger accumulation of unrealized returns will be able to absorb a larger spread before it impacts their score very heavily, but as their positions become older it will likely adversely impact their positional score as prior unrealized returns are taken off the table. The following formula is used to translate the ratio into a penalty multiplier:
Here is a visualization of the two penalty curves proposed for positions, with the blue plot highlighting the realized / unrealized ratio penalty:
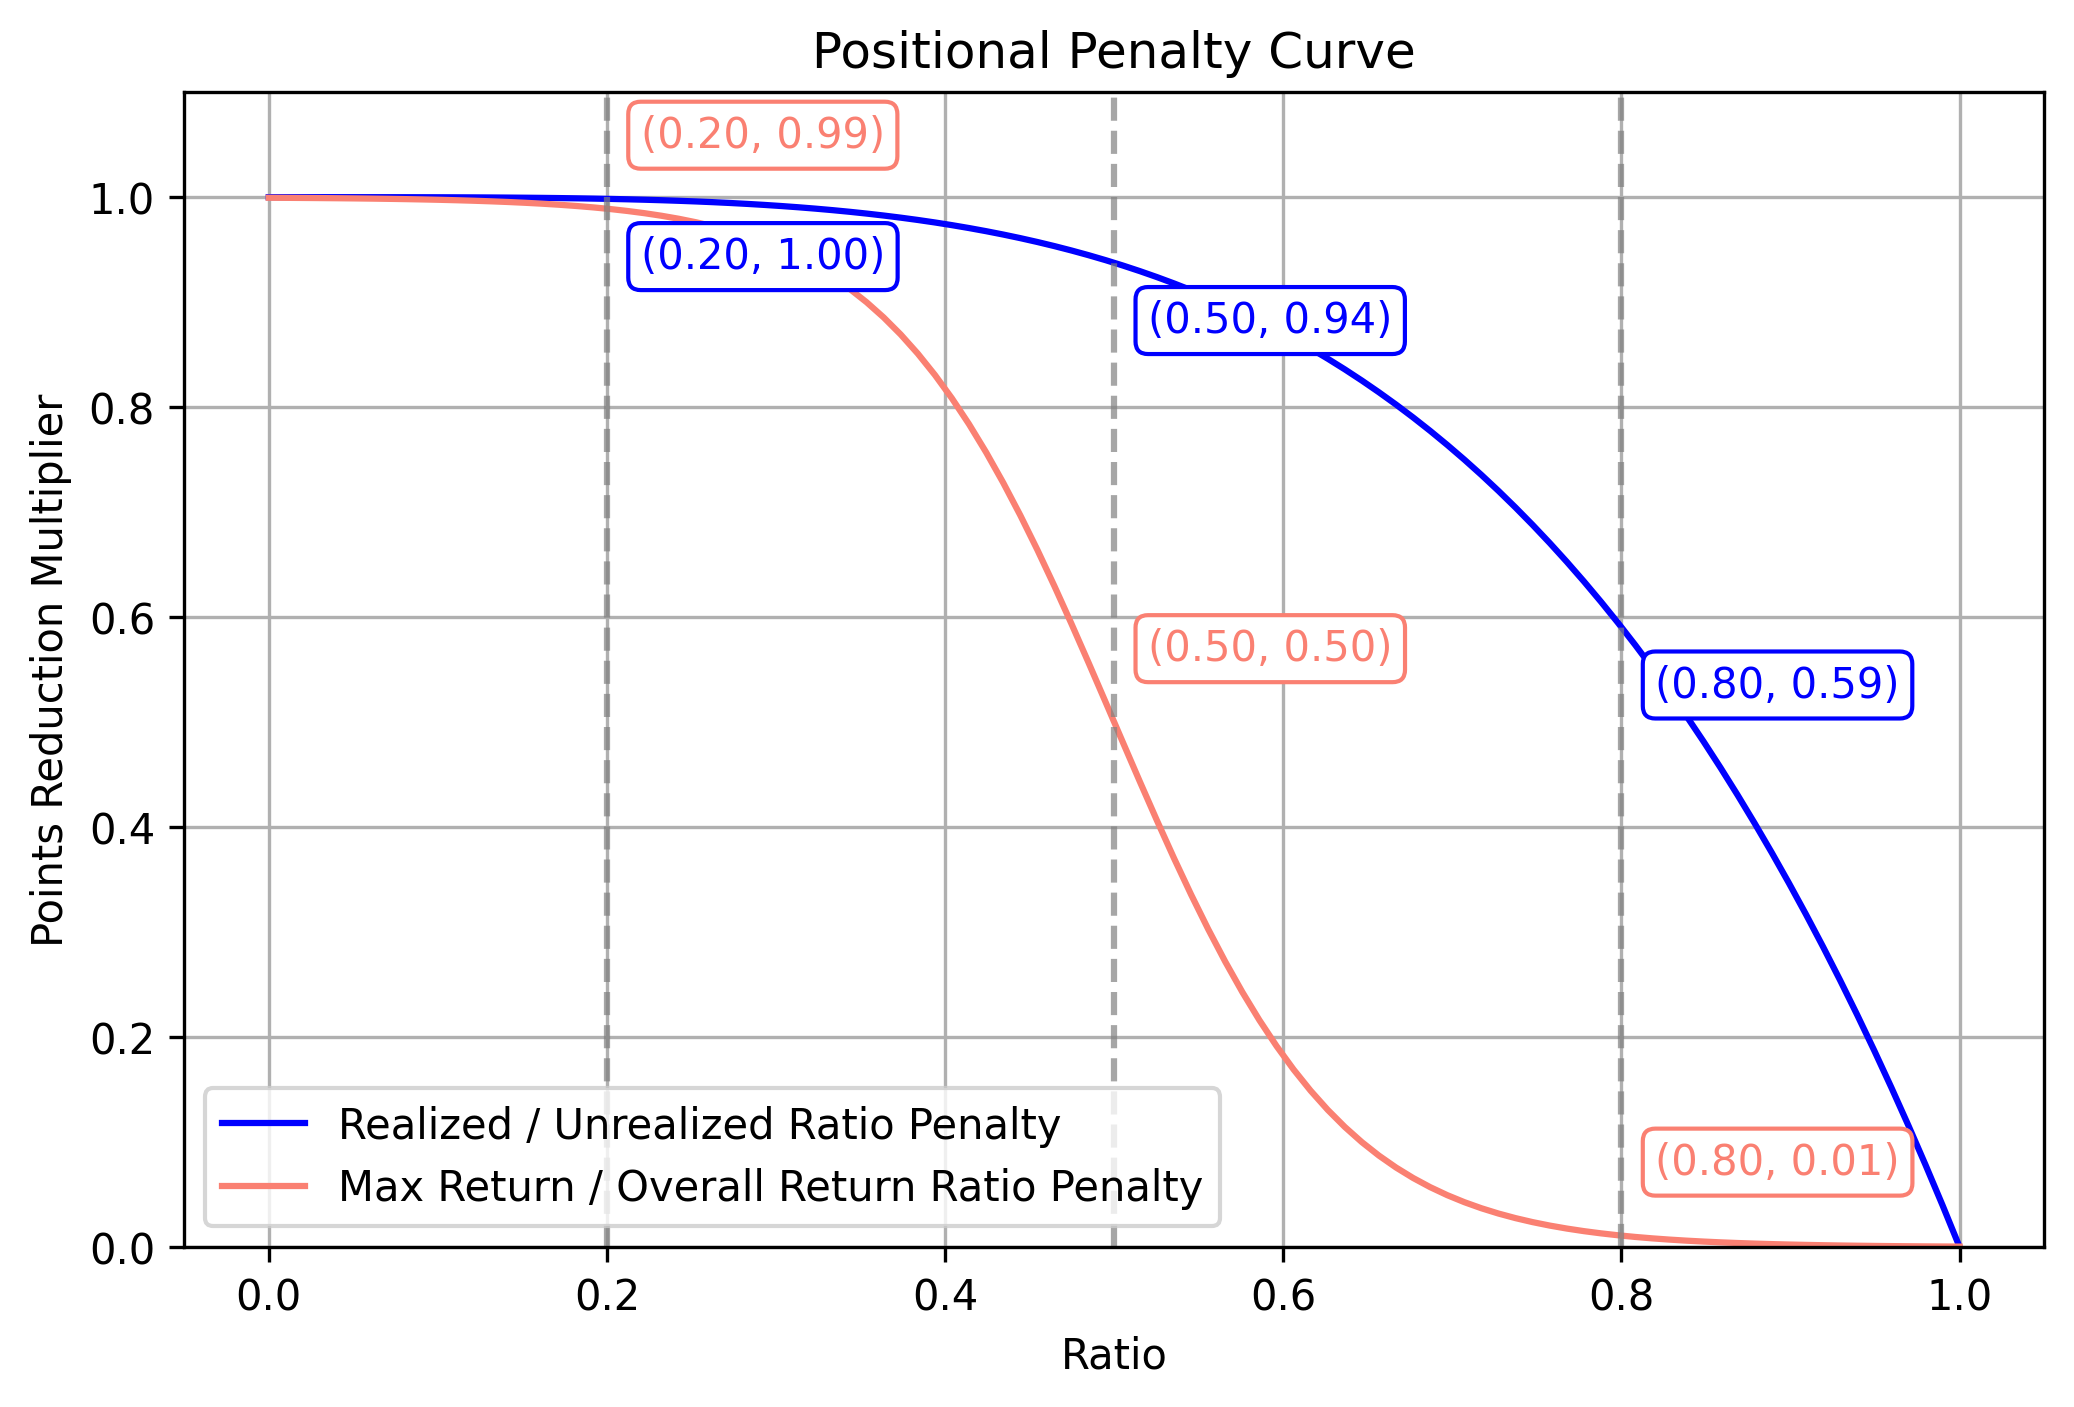
With its current formulation in this proposal, there is essentially no penalty with a ratio of less than 20%. The penalty for a discrepancy of 50% would be a 6% reduction in score, with a more substantial 39% reduction from an 80% discrepancy in score. Here is how the penalty would have likely evolved and changed for one of our top miners (5FmqXG5YBU1Hke9jHD5FT41CUM9gVod7nFgYvbd7PmpqcUJm), had they started trading exactly one month ago:
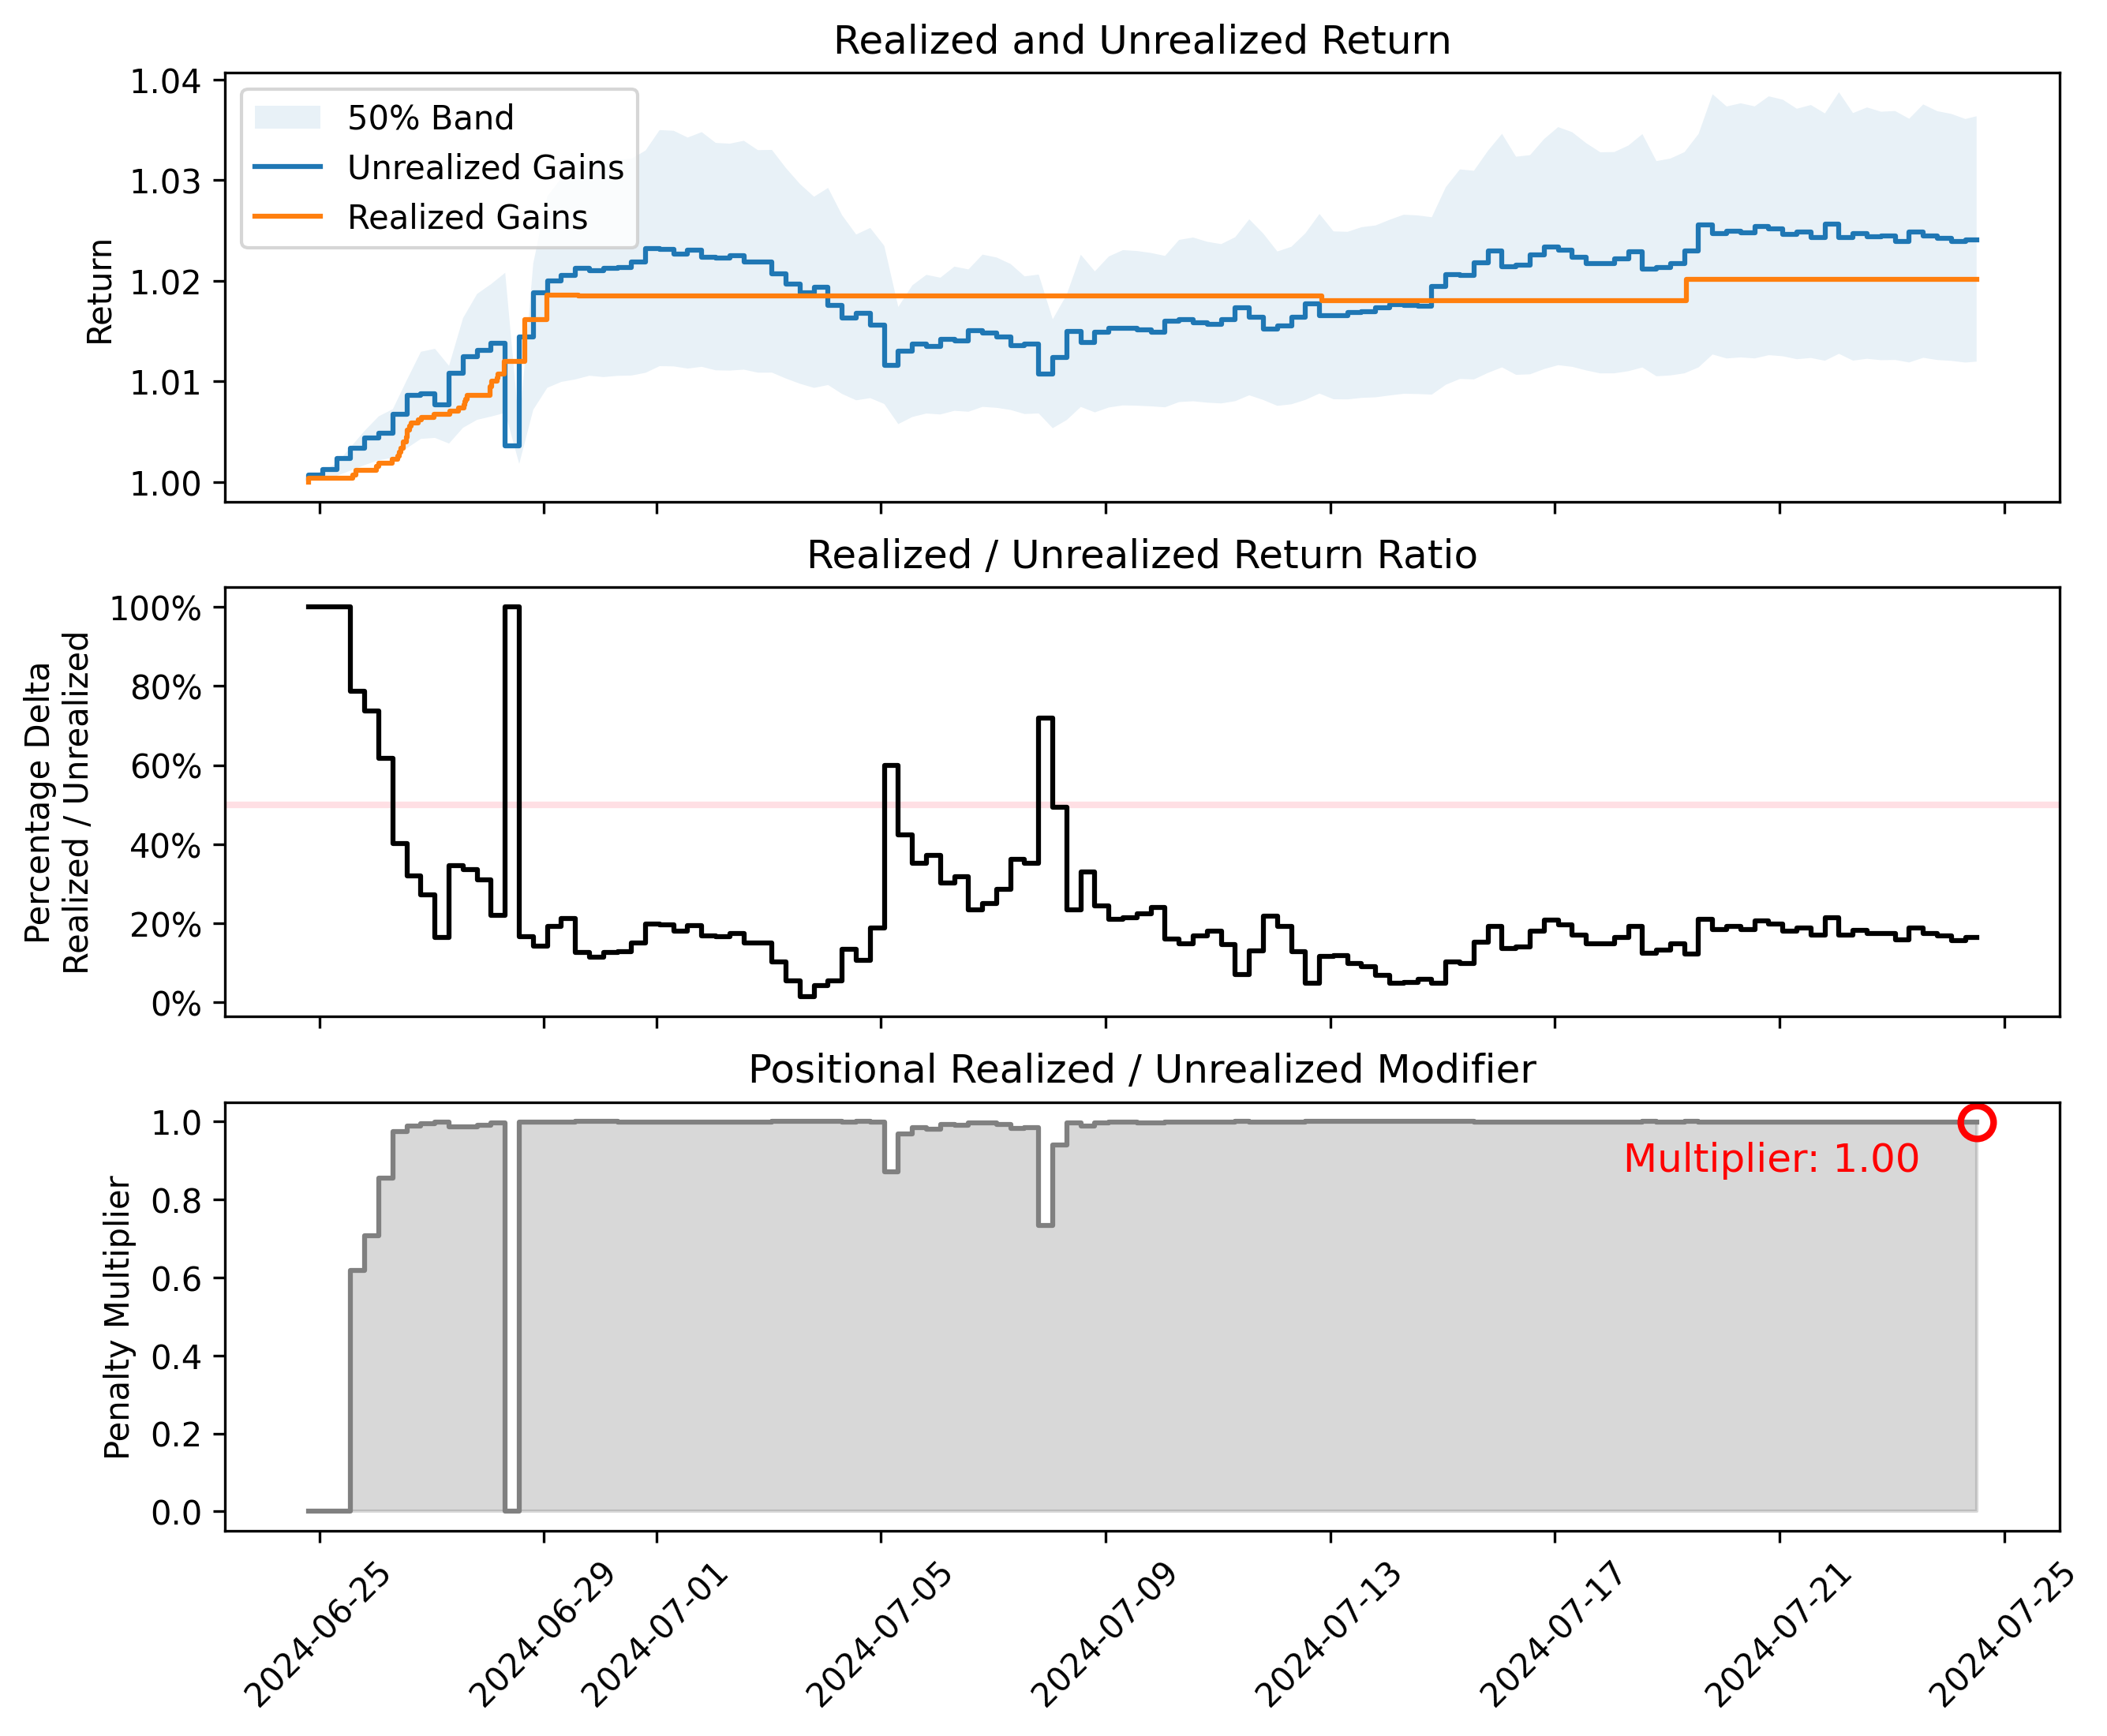
The first plot depicts the miner’s realized and unrealized returns, overlayed onto the same chart. The faint backfilled plot shows a 50% difference in unrealized returns, which is required to score a 6% loss in score. If the yellow line representing realized returns is outside of these boundaries, the miner will absorb at least 6% reduction in score.
The second chart plots the ratio between realized and unrealized returns, shown as a percentage. A value of 100% here would therefore indicate that the difference between the unrealized and realized returns is the same order of magnitude in size relative to the unrealized returns. This could either mean that the realized returns are twice the size of the unrealized returns, or there are no realized returns. A faint pink line indicates the 50% mark, which has the same intuition from the first plot with the backfilled boundaries.
The third plot shows the magnitude of this penalty component, which will multiply by the overall score of the miner to determine their final output, along with the other penalties.
Max Returns Ratio
We will again look at all positions which were opened and closed within the prior 30 day lookback window. The max return from a single position will be compared to the total returns from all closed positions as a ratio. The prior plot shows the max return ratio penalty as well, which is the sigmoid curve highlighted in pink.
This means that if a miner has a single position which accounts for 20% of their total realized returns, they will receive a 1% reduction in score, and a max position representing 50% of their realized returns would result in a 50% drop in score. Consider the following closed positions from the miner 5DCzvCF22vTVhXLtGrd7dBy19iFKKJNxmdSp5uo4C4v6Xx6h:
| Position UUID | Trade Pair | Open Time | Close Time | Return at Close |
|---|---|---|---|---|
| 66608717-e4e9-4fe5-b37f-e6fa34595b66 | BTCUSD | Fri Jun 28 2024 11:00:01.590 | Fri Jun 28 2024 11:04:11.816 | 0.9987 |
| 72ca70b5-ba38-4f85-b0e5-af2eabdb6a3a | USDJPY | Fri Jun 28 2024 12:19:50.812 | Fri Jun 28 2024 12:35:48.600 | 1.0032 |
The miner’s overall return was positive, registering a 0.2% gain between the two positions. We will therefore look for the maximum return on positions with positive return at close, which is a 0.32% gain for our miner. The ratio between the two provides our max returns ratio: 0.32% / 0.2% = 1.60. Well above 1, this will set the miner’s max returns multiplier to 0, providing them with zero score. If the miner is able to continue closing winning positions, the cumulative return at close would increase and their overall penalty would decrease.
Scoring distribution
Prior, we have been using the exponential distribution to spread incentive amongst top miners. This dynamically adjusts based on the number of miners in the system, with targets set on the amount of incentive to distribute to the top percentage of miners. However, this distribution was determined based on the number of nonzero miners and their rankings, not their score. The specific distribution implementation may be found here.
While this helps us have fine grained control on the emissions directions for each miner, we want to be able to continue providing incentive for the top miner to improve beyond their competition, and we want the incentive provided to miners to dynamically adjust based on their relative performance, not just their ranking. We propose the use of a softmax with lower temperature to distribute incentive, which will dynamically adjust based on the relative performance of each miner. Based on current miner performance, this will attribute about 40% of emissions to the top 5 miners:
Additional Information
We now have three primary criteria for our miners to demonstrate sustainable growth:
- A checkpoints consistency penalty
- A max closed position penalty
- A ratio of realized and realized returns
To summarize some tips that will likely help you avoid most of the penalties:
- Have some level of trading activity on our platform for at least 2 weeks.
- Close positions any time your unrealized returns over the prior lookback period (30 days) changes by 10% or more to keep your realized and unrealized returns in sync.
- Open and close at least 5-10 positions per month.
- Keep positions relatively short, ideally less than three days per position.
- Avoid concentrating all returns for the month on just one day of trading, at a bare minimum spread them through the day.
- Avoid having all of your returns concentrated on one position. If this is your current situation, try to close more trades which balance the distribution of returns to more positions.
We will likely revisit the specific values for these posiional penalties when we roll out to a longer lookback window, as the ratios against overall returns will shift. Longer time windows should also help to relax the difficulty of meeting these criteria as they are based on comparisons with total returns.
We want to give you more time to digest this proposal, so we’re proposing to wait a week before integrating it into Vanta Network. We also encourage you to start picking up some of these tips in advance so we transition smoothly when it rolls out.
Timeline
Proposal Delivery: July 27, 2024
PR: July 27, 2024
Integration: August 2, 2024